Nevron Logo

Nevron Map for SSRS Features

General Features

Support for all versions of SQL Server and Visual Studio (SSDT) since 2008

Nevron Barcode for SQL Server Reporting Services introduces a new level of data visualization, designed to extend your reports within SSRS 2005, 2008, 2008R2, 2012, 2014, 2016, 2017, 2019, and 2022 editions.

Multiple Map Layers

Nevron Map for SSRS supports an unlimited number of map layers. Each map layer can display either a predefined or custom ESRI map. Each layer can be individually bound to the underlying data source, filled with a fill rule, or have per shape dynamic appearance.

Multiple Legends

Nevron Map for SSRS supports an unlimited number of map legends. Each layer can be associated with a different legend. Each layer can display layer-specific information on its layer. Map legends can be manually positioned or docked to map or map area.

Multiple Titles

Nevron Map for SSRS supports unlimited number of map titles. Map titles which can be manually positioned or docked to map or map area.

Map Templates

Nevron Map for Reporting Services supports saving and loading templates. Save the map state from the designer to XML and then import it in in a different report item. The state generated by the VS2005, VS2008, VS2010, VS2012, VS2013, VS2015, VS2017 and VS2019 report items is compatible, meaning you can easily convert reports generated with different versions of Visual Studio.

Map Layers

Nevron Map for SSRS supports an unlimited number of map layers. Each map layer can display either a predefined or custom ESRI map The report item comes with the following built-in maps:
  • Map of the World
  • Map of USA
  • Maps for all USA states.
Additionally, you can import any map that is available in ESRI format. The ESRI map import loads both ESRI geospatial and database data so that you can perform data binding on both predefined and custom ESRI maps.

Each map layer can have its settings for fill rule, display on legends, and dynamic shape appearance and action.

Map Fill Rules

When making choropleth maps, you are often required to fill the map using a filling rule that splits the input dataset into a user-defined number of ranges. Nevron Map for SSRS supports two- and three-color filling rules with a user-specified number of ranges. The dataset is automatically split into the specified ranges according to one of the following distribution rules:
  • Equal - also known as quantiles. This method allows for unequally sized data intervals and involves adjusting the interval limits until an equal number of data points can be slotted into each interval.
  • Equal Interval - also known as equal ranges (or steps). This method involves the division of the entire data range into equally sized intervals.
  • Optimal - adjusts the size of data intervals to minimize the classification error, and thus the map looks more balanced, and the results seem correct, with just a few shapes in the highest class as one would expect.

Map Projections

To see geographical data on a 2D device (monitor or printer), this data must be projected to a 2D plane using a map project that transforms longitude/latitude coordinates into 2D coordinates. Nevron Map for SSRS supports 22 map projections, including:
Aitoff


Aitoff- Proposed by David A. Aitoff in 1889, it is the equatorial form of the azimuthal equidistant projection but stretched into a 2:1 ellipse while halving the longitude from the central meridian.
Bonne Projection


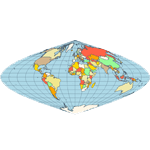
Bonne- a pseudoconical equal-area map projection. ll parallels are standard, with the same scale as the central meridian; parallels are concentric circles—no distortion along the reference parallel or the central meridian.


Cylindrical Equal Area Projection

Cylindrical Equal-Area - represents a cylindrical equal-area projection of the Earth. The following is a summary of cylindrical equal-area projection's special cases:

  • Lambert- standard parallel of 0 degrees
  • Behrmann- standard parallel of 30 degrees
  • Tristan Edwards- standard parallel of 37.383 degrees
  • Peters- standard parallel of 44.138 degrees
  • Gall- standard parallel of 45 degrees
  • Balthasart- standard parallel of 50 degrees
Equirectangular Projection


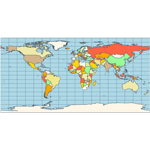
Equirectangular - a projection that maps meridians to equally spaced vertical straight lines and parallels to equally spaced horizontal straight lines.
Eckert IVProjection


Eckert IV - pseudocylindrical and equal-area projection. The central meridian is straight; the 180th meridians are semi-circles, and other meridians are elliptical. Scale is true along the parallel at 40:30 North and South.
Eckert VIProjection


Eckert VI - pseudocylindrical and equal-area projection. The central meridian and all parallels are at right angles. All other meridians are sinusoidal curves. Shape distortion increases at the poles. Scale is correct at standard parallels of 49:16 North and South.
Hammer


Hammer- an equal-area map projection, described by Ernst Hammer in 1892. Directly inspired by the Aitoff projection, Hammer suggested using the Lambert azimuthal equal-area projection's equatorial form instead of Aitoff's use of the azimuthal equidistant projection. Visually, the Aitoff and Hammer projections are very similar, but Hammer has seen more use because of its equal-area property.
Kavrayskiy VII


Kavrayskiy VII - a map projection invented by V. V. Kavrayskiy in 1939 for a general-purpose pseudocylindrical projection. Like the Robinson projection, it is a compromise intended to produce good quality maps with low distortion overall. Despite straight, evenly-spaced parallels and a simple formulation, it scores well compared to other widespread projections, such as the Winkel Tripel. It has been used in the former Soviet Union but is almost unknown in the Western world.
Mercator Projection
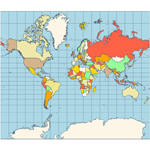
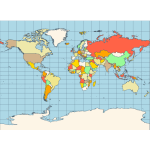
Mercator- introduced in 1569 by Gerardus Mercator. It is often described as a cylindrical projection, but it must be derived mathematically. The meridians are equally spaced, parallel vertical lines, and the parallels of latitude are parallel, horizontal straight lines, spaced farther and farther apart as their distance from the Equator increases. This projection is widely used for navigation charts because any straight line on a Mercator-projection map is a line of constant true bearing that enables a navigator to plot a straight-line course. It is less practical for world maps because the scale is distorted; areas farther away from the equator appear disproportionately large. On a Mercator projection, for example, the landmass of Greenland appears to be greater than that of the continent of South America; in the actual area, Greenland is smaller than the Arabian Peninsula.
Miller Cylindrical Projection


Mollweide Projection


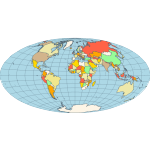
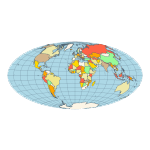
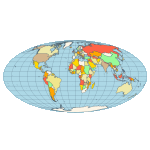
Mollweide-The Mollweide projection is a pseudocylindrical map projection generally used for global maps of the world (or sky). Also known as the Babinet projection, homolographic projection, or elliptical projection. As its more explicit name Mollweide equal-area projection, indicates, it sacrifices fidelity to angle and shape in favor of an accurate depiction of the area. It is used primarily where a precise representation of area takes precedence over shape, for instance, small maps depicting global distributions.
Orthographic Projection


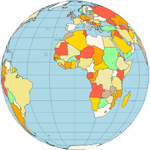
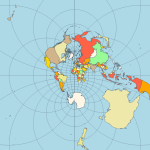
Orthographic- a perspective (or azimuthal) projection, in which the sphere is projected onto a tangent plane. It depicts a hemisphere of the globe as it appears from outer space. The shapes and areas are distorted, particularly near the edges, but distances are preserved along parallels.
Robinson Projection
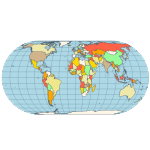
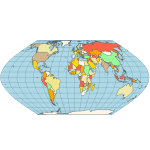
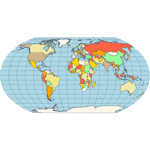
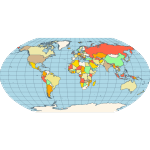
Robinson- made in 1988 to show the entire world at once. It was specifically created in an attempt to find the good compromise to the problem of readily showing the whole globe as a flat image. The projection is neither equal-area nor conformal, abandoning both for a compromise. The creator felt this produced a better overall view than could be achieved by adhering to either. The meridians curve gently, avoiding extremes, but thereby stretch the poles into long lines instead of leaving them as points. Hence distortion close to the poles is severe but quickly declines to moderate levels moving away from them. The straight parallels imply severe angular distortion at the high latitudes toward the outer edges of the map, a fault inherent in any pseudocylindrical projection.
Stereographic Projection


Stereographic- it is a particular mapping (function) that projects a sphere onto a plane. The fact that no map from the sphere to the plane can accurately represent both angles (and thus shapes) and areas is the fundamental problem of cartography. In general, area-preserving map projections are preferred for statistical applications because they behave well with respect to integration, while angle-preserving (conformal) map projections are preferred for navigation. The stereographic projection falls into the second category.
Vander Grinten Projection


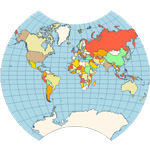
Van der Grinten- neither equal-area nor conformal projection. It projects the entire Earth into a circle, though the polar regions are subject to extreme distortion. The projection offers a pleasant balance of shape and scale distortion. A boundary is a circle; all parallels and meridians are circular arcs (spacing of parallels is arbitrary)—no distortion along the standard parallel at the equator.
Wagner VI


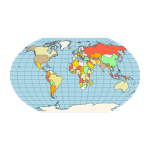
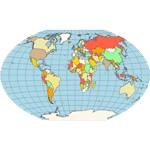
Wagner VI -a pseudocylindrical whole Earth map projection. Like the Robinson projection, it is a compromise projection with no special attributes other than a pleasing, low distortion appearance.
Winkel Tripel Projection


Winkel Tripel- a modified azimuthal map projection proposed by Oswald Winkel in 1921. The projection is the arithmetic mean of the equirectangular projection and the Aitoff projection. Goldberg & Gott shows that the Winkel Tripel is arguably the best overall whole-earth map projection known, producing minimal distance errors, small combinations of ellipticity and area errors, and the smallest skewness of any map. In 1998, the Winkel Tripel projection replaced the Robinson projection as the standard projection for world maps made by the National Geographic Society.

Map Parallels and Meridians

Nevron Map for SSRS features complete control over the map parallels and meridians visibility, appearance, and step. You can display parallels and meridians with fine, normal, or coarse density. Parallels and meridians can be displayed behind or above the map.

Map Bounds, Centering and Zooming

Nevron Map for SSRS allows you to control the displayed geographical bounds in several ways:
  • Fit To Bounds - the map is fitted to automatically determined bounds or custom ones. You can individually specify automatic or custom min and/or max longitude and/or latitude values for the map bounds.
  • Fit To Layer - the map is fitted to the content of a user specified layer. This is useful when you display multiple layers and want to zoom to a specific one.
  • Fit to Data Bound Shapes - not all shapes of the map can be bound to the respective layer data table. This mode lets you zoom only to the shapes which are bound to data.
  • Fit to Matching Shapes - lets you fit the map to the shapes that match a specific criteria.
Nevron Map for SSRS can be zoomed to a user-specified zoom percent.

Nevron Map for SSRS can also be centered in several ways:
  • Center To Percents - the map is centered to use specified percents relative to the current map bounds.
  • Center To Layer - the map is centered to a specific map layer.
  • Center To Data Bound Shapes - not all map shapes can be bound to the respective layer data table. This mode lets you center the map to the shapes bound to data.
  • Center To Matching Shapes - lets you center the map to the shapes that match specific criteria.

Additional Customizations

Following is a brief list of some of the most important additional customization options that the chart designer visually exposes:

Titles

  • Titles visibility
  • Titles appearance
  • Titles action

Legends

  • Advanced positioning options
  • Items layout preferences
  • Control over legend marks
  • Header and Footer
  • Gridlines
  • Stripes
  • Legend action

Per Layer Properties

  • Hide shapes without data
  • Choose value data field
  • Choose text data field
  • Hide/show texts
  • Choose polygon labeling mode
  • Per shape appearance, visibility and action

Data Groupings Editors

  • Edit grouping expressions
  • Edit filter expressions
  • Edit sorting expressions

Rendering

  • Support for different image formats
  • Specify resolution
  • Image sizing options
  • Gray scale rendering
  • On/off image map rendering
  • Control over the currently used culture settings. You can select a custom culture or synchronize the currently used culture with the user's regional settings.

Appearance Customizations

  • Fill Style editor - helps you define the filling of an element. Provides options for solid color, gradient, image and advanced gradient fill types.
  • Stroke Style editor - helps you define the outline/stroke of an element. Provides options for line caps and joins, line pattern and color.
  • Shadow Style editor - helps you define the shadow which is casted by an element. Provides options for solid, linear, radial blur and gaussian blur shadows.
  • Text Style editor - helps you define the default appearance of a text element. Provides options for font size and type, font filling, outline, shadow, backplane etc.
  • Frame Style editor - helps you define the frame of the component and its panels. Supports artistic/image borders.

Map Code Customization

Nevron Map for Reporting Services supports customization through C# code, which allows you to use the full Nevron Chart for .NET and Nevron Diagram for .NET APIs in SSRS.