ProductsAll Products
.NET Components
DownloadsAll Downloads
The diversity of data sources makes it difficult for any organization to create or incorporate a solution that handles all types of data that consistently comes from various origins. The needs further increase the complexity of any such solution for the organization to be able to perform data analysis and be able to display the results graphically. To make it even more complex, any such solution must provide a web-based configuration interface so that users with no technical experience should be able to configure it.
At the time of writing this article, there is no viable solution that can handle all these aspects directly in the SharePoint environment. Nevron Chart for SharePoint aims to address this gap in the SharePoint data visualization space.
Another aspect, which makes the pivot data analysis popular, is the ability to perform visual queries. Before pivot analysis tools, developer experience was needed to write complex SQL queries and stored procedures to achieve the same functional result. With pivot analysis tools, users with no developer experience (e.g., end-users) can author complex queries by simply dragging and dropping dataset fields to define grouping and summary values.
Currently, all reporting tools are using pivot engines to perform data analysis, and pivot engines in more simple forms are available in many end-user products.
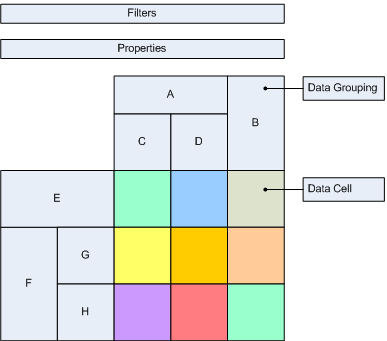
For example: the pivot data analysis features of Excel are simple. For a table that has two columns – company and sales, you can display a pivot tablix that group the columns by company, sorts the columns in increasing/decreasing order based on the sum of sales and display the sum of sales as data values.
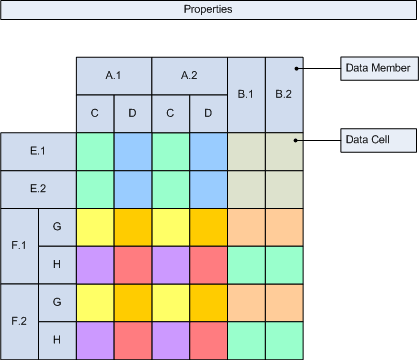
As the tables grew in size and diversity of information, the need for pivot engines that perform more sophisticated queries emerged. The simple expression format represented by field + formula couples evolved to functional languages in which formula-based expressions define grouping, sorting, filtering, and data values summaries. Furthermore, the sophisticated pivots allow for multiple grouping expressions, sorting rules, filtering rules, and summary values extracted on all possible levels of the data aggregation. This gives the IT professionals the flexibility to create reports and dashboards that truly address the specificity of the data and extract valuable information quickly and easily – performing the same tasks from scratch is tough, expensive, or even impossible.
For example, the pivot data analysis in Reporting Services and other major reporting and BI providers use formula-based expressions to calculate summary values at all levels of data aggregation (row and column data members, etc.) and support multiple grouping, filtering, and sorting rules.
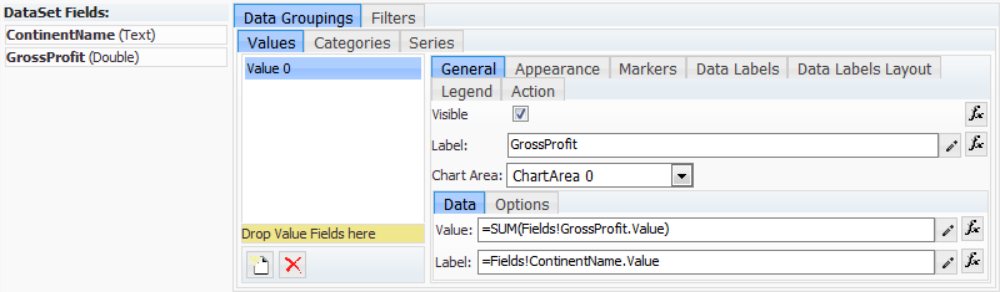
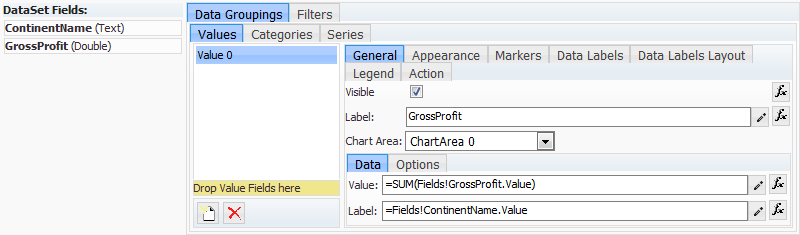
Nevron Chart for SharePoint internally uses the Nevron Pivot engine. The Nevron pivot engine is functionally classified as advanced since it uses formula-based expressions, summary values can be calculated at all levels of the data aggregation, and support multiple grouping, filtering, and sorting rules. The functional language of the Nevron pivot engine is advanced since it offers a myriad of functions that help you deal with any numeric, date, time, time span, boolean, text, or array data. Many available pivot engines support aggregate functions (like SUM, AVERAGE, etc.), but only a few support function chaining. Chain functions allow you to perform a series of data transformations before the data aggregation – for example, suppose that you need to calculate the sum of the absolute values for a field – with the Nevron Pivot engine, you can write =(SUM(ABS(Fields!sales)) – in this example the ABS function is a chain function.
A data source invariant pivot engine will connect to any data source that can provide a tabular representation of its data (also called “in-memory” pivot engines). The advantage of using such tools is that you can have the same pivot aggregation features regardless of the data source. The disadvantage of such tools is that they are slower than data source-specific engines when aggregating large tables (with millions of records) residing on remote servers.
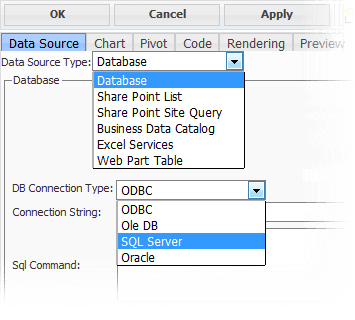
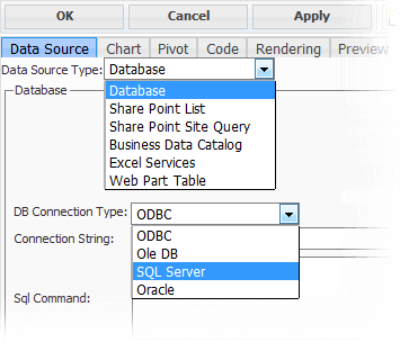
We chose to implement the Nevron Pivot Engine as a data source invariant pivot engine because of the heterogeneous nature of the data managed by SharePoint servers and because we needed complete control over the pivot engine customization for higher-level tasks like data visualization. The Nevron Pivot Engine can be connected to the following types of data sources: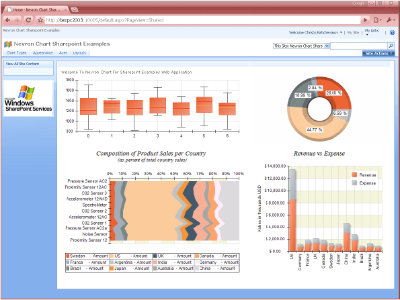
Nevron Chart for ASP.NET is a product of Nevron's long and true commitment to charting technology.
It is briefly demonstrated in the following online demo: Nevron Chart for ASP.NET Online Examples. It is safe to say the charting engine behind Nevron Chart for SharePoint is one of the most advanced in the charting industry today.


Nevron Chart for Reporting Services enhances the charting abilities of SQL Server Reporting Services. It handles the differences in the 2005 and 2008 editions by abstracting itself with a pivot engine invariant pivot charting model. Internally Nevron Chart for SharePoint uses this pivot charting model
* For more details regarding Nevron Chart for SQL Server Reporting Services visit: Nevron Chart for SSRS
The benefits of such an approach are visible – you can streamline your pivot charting efforts at all levels of your organization – from SQL Server Reporting Services authors to SharePoint users and general WinForms – WebForm developers – they all receive the same quality pivot charting functionally for a diverse range of .NET platforms.

Although a RIA solution would have been much simpler for implementation (both Flash and Silverlight are providing a wealth of user interface elements) – we decided that a true SharePoint solution must not require any third party plugins and be purely browser based.
After all, any web-based CMS, such as SharePoint, should require only a browser, and the components integrated into it should follow.
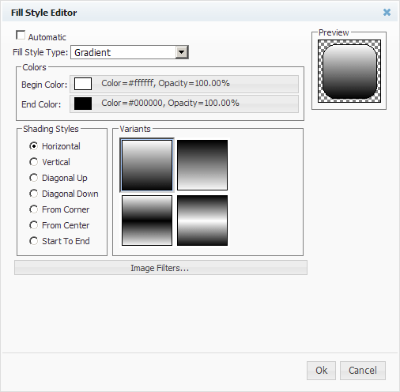
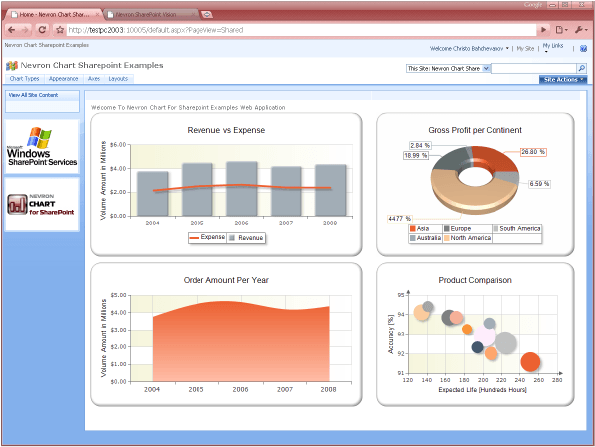
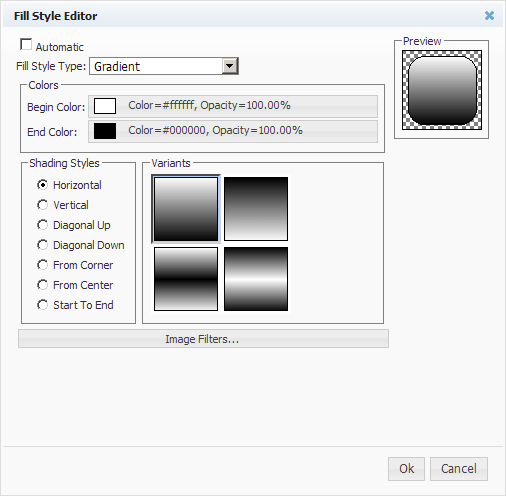
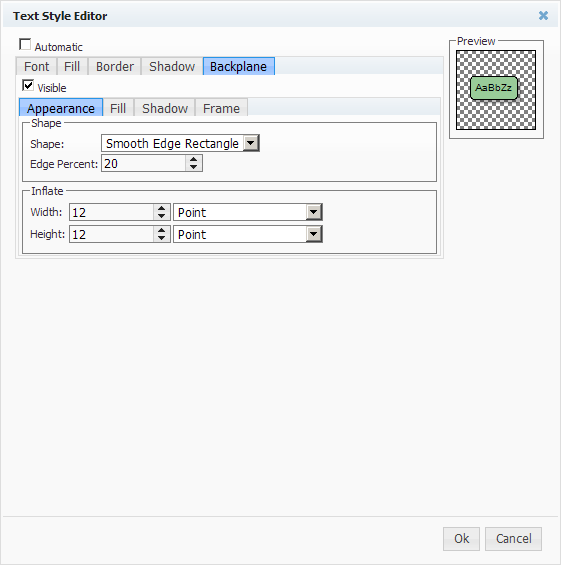
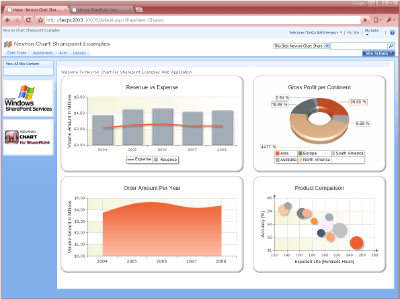
The web-based configuration of Nevron Chart for SharePoint is one of its significant strengths compared to other charting solutions available today. Most such solutions require an RIA platform installed (Flash or Silverlight) or use postbacks resulting in slow web editing. The Nevron Chart for SharePoint Web Designer extensively uses AJAX and does not use postbacks, resulting in fast web-based editing requiring no plugins.
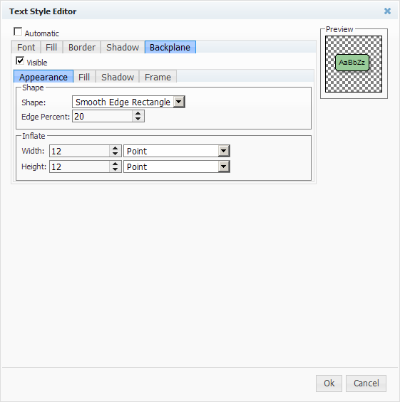
Furthermore, we have spared no effort to provide a wealth of customization settings that help you fine-tune even the small details of your pivot charts. The result is a full-featured web-based chart designer that would make many desktop programs envious.
An in-depth observation of all currently known standalone charting solutions for SharePoint reveals that they either have no pivot data aggregation features or are so limited that they are practically useless for most cases. Before Nevron Chart for SharePoint, advanced pivot charting in SharePoint was only available as part of report viewers for enterprise reporting tools and via Excel services. Both types of solutions are tough to install, are expensive, and do not blend very well with the web-specific requirements of SharePoint. Furthermore, none of these solutions can be easily configured through a web interface nor provides truly advanced charting.
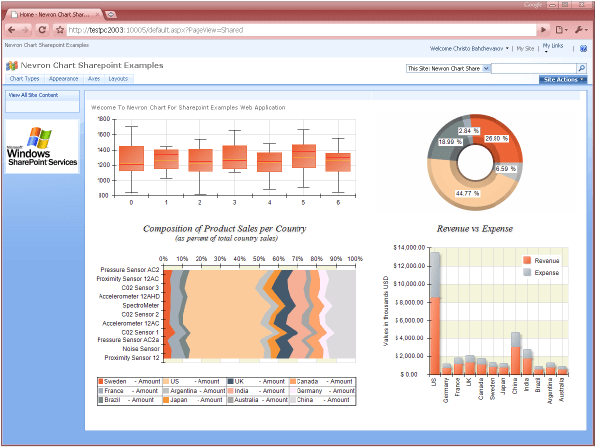
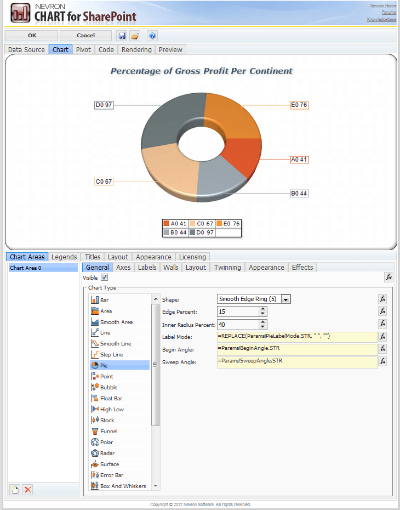
When comparing the charting abilities of different charting solutions it is again not hard to discard the majority of them – they are simply not complete - support only a limited number of charting types, a few settings, have no abilities for 3D, do not support combo charting, have a single charting area etc. In contrast Nevron Chart for SharePoint is complete in terms of all chart related features – it supports more than 170 distinct 2D and 3D charting types, has many advanced settings, supports multiple charting areas, axes, legends and titles, has built-in support for combo charting and many more… which ensures that you never run out of charting features when you need them.
Comparing the charting abilities of different charting solutions, it is not hard to discard the majority of them: they are not complete, support only a limited number of chart types, a few settings, have no abilities for 3D, do not support combo charting, have a single charting area, etc. In contrast, Nevron Chart for SharePoint is complete in terms of all chart-related features: it supports more than 170 distinct 2D and 3D charting types, has many advanced settings, and supports multiple charting areas, axes, legends, and titles, has built-in support for combo charting and many more. All these features ensure you never run out of charting features when needed.
Now that you know why Nevron Chart for SharePoint is the solution for all your advanced pivot charting needs in SharePoint, it’s time to download the evaluation and see for yourself what it can do with your data – visually and directly in SharePoint.