Nevron Logo

Diagram Orthogonal Graph Layout

Nevron Diagram for .NET - Orthogonal Graph Layout

Introduction

The research area of graph drawing has become an extensively studied field which presents an exciting connection between computational geometry and graph theory. The wide spectrum of applications includes VLSI­layout, software engineering, project management, database relations management, etc. There are a lot of algorithms out there that take as input a graph and try to produce a nice drawing of it. They use different approaches and make nice drawings for the type of graphs they are designed to draw best. For example tree layouts produce very nice drawings of trees but if the input graph is not a tree you will not be pleased by the result.

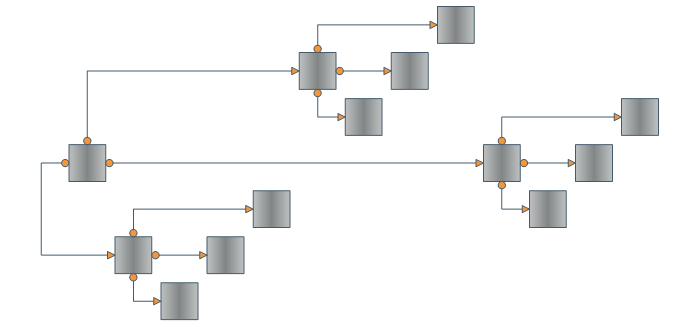
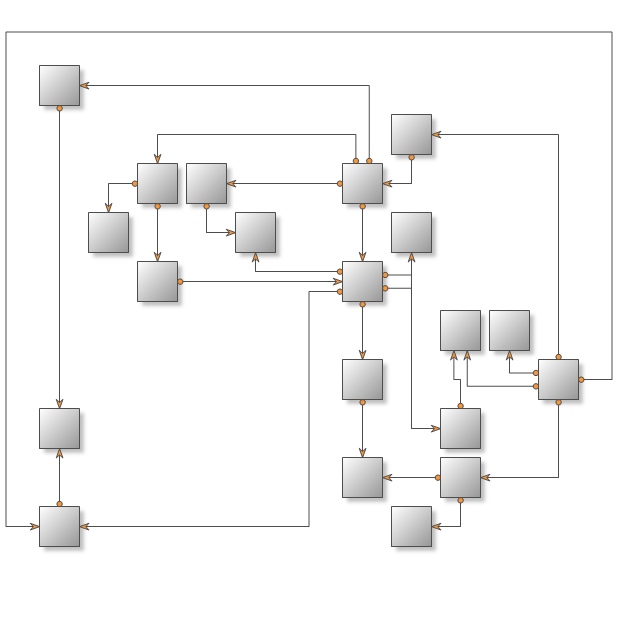
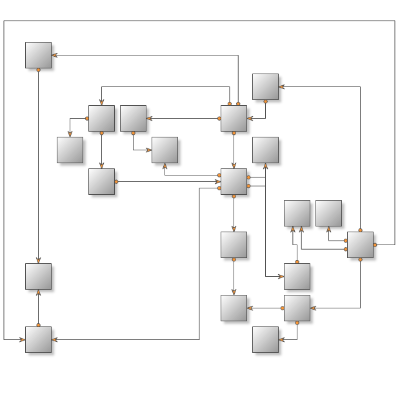
There's only one layout algorithm that can produce a nice drawing of almost every kind of graph. This is the Orthogonal Graph Layout Algorithm. As you can expect its unmatched power and universality come with a price – it is very complex and extremely hard to implement. That's why Nevron is proud to present you the NOrthogonalGraphLayout class which implements the orthogonal graph drawing algorithm. An orthogonal drawing of a graph is an embedding in the plane such that all edges are drawn as sequences of horizontal and vertical segments. In particular for non­planar and non­biconnected planar graphs, this is a big improvement. The algorithm is complex and very hard to implement, but it is fast and handles both planar and non­planar graphs at the same time.

Let G = (V; E) be a graph, n = |V|; m = |E|. A point where the drawing of an edge changes its direction is called a bend of this edge. If the drawing of an edge has at most k bends we call this edge k­-bent. An orthogonal drawing is called an embedding in the rectangular grid if all vertices and bendpoints are drawn on integer coordinates.

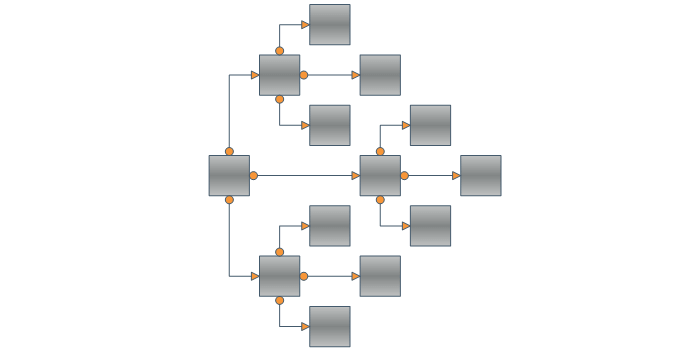
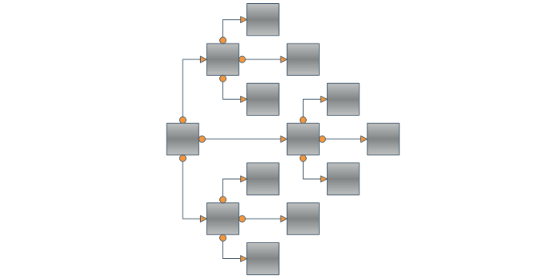
Our algorithm takes as input a simple graph and produces an orthogonal grid drawing. Note that if the input graph is planar, the resulting drawing is also planar (i.e. without edge crossings). In the case of non-planar graphs the edge crossings are inevitable but the algorithm tries to keep their number as low as possible. For both planar and non-planar graphs the layout offers a great improvement in the readability of the graph by maintaining the following aesthetic criteria (given by their priority in descending order):

- minimal number of edge crossings (0 for planar graphs)
- minimal number of bends
- minimal area of the final drawing

Implementation

In order to produce edge crossing free drawings of planar graphs, we should check if the graph is planar and if it is, then we must find a planar embedding of the graph. This means that we should reorder the adjacency list matrix of the graph in such a way that the neighbors of each vertex are listed in a clockwise direction as they will appear in the final drawing.

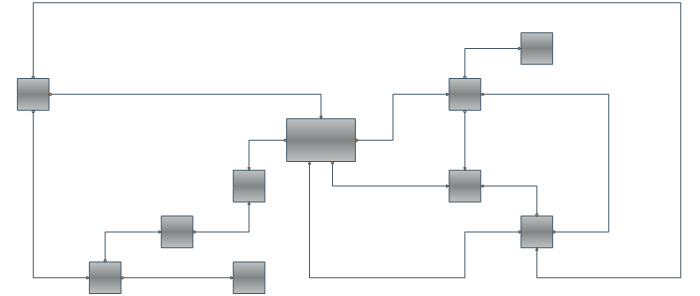
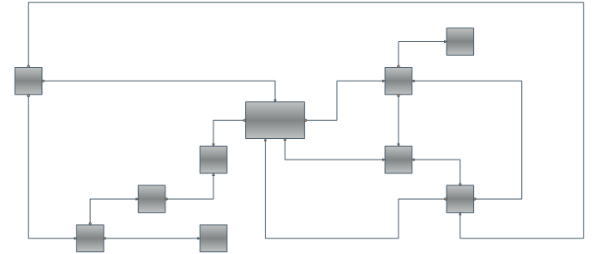
When planarity testing is completed and the planar topology of the graph is determined, we must obtain the faces of the planar graph. The execution of the algorithm can be viewed as person walking along the edges of the graph, continuously choosing the rightmost option at every vertex.

An orthogonal drawing of a graph is an embedding in the plane such that all edges are drawn as sequences of horizontal and vertical segments. In particular for non­planar and non­biconnected planar graphs, this is a big improvement. The algorithm handles both planar and non­planar graphs at the same time.

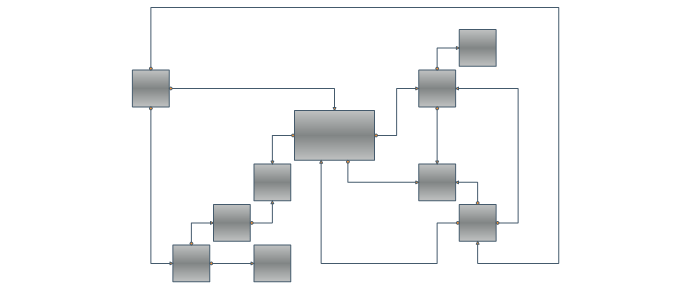
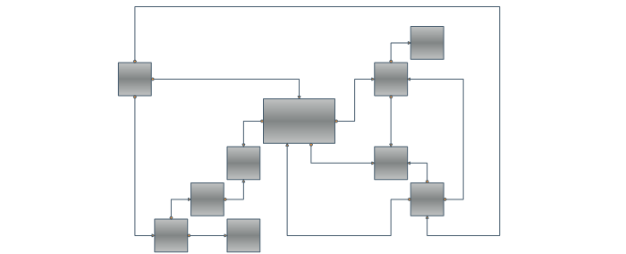
After building the orthogonal shape we perform a compaction step which deals with 2 important tasks: compaction of the total area of the drawing and bend minimization. Finally we calculate the coordinates of the vertices and edges of the grid drawing and render them using the Nevron Diagram Rendering Engine.

Users Manual

The NOrthogonalGraphLayout class is the class that implements the Nevron orthogonal layout algorithm. It is a direct descendant of the NGraphLayout which ensures that it is very easy to use and provides similar user experiences as all other layouts in the Nevron Diagramming Component. The layout accepts as input a simple graph and produces an orthogonal grid drawing. Note that if the input graph is planar, the resulting drawing is also planar (i.e. without edge crossings). In the case of non-planar graphs the edge crossings are inevitable but the algorithm tries to keep their number as low as possible. For both planar and non-planar graphs the layout offers a great improvement in the readability of the graph. The most important properties are:
  • UseCompaction – if set to true, a compaction algorithm will be applied to the embedded graph. This will decrease the total area of the drawing with 20 to 50 % (in the average case) at the cost of some additional time needed for the calculations. See the example below of a tree with 13 vertices and 12 edges:

    Orthogonal Graph Layout No Compaction

    Fig. 1
    Orthogonal Graph Layout Compaction

    Fig. 2


  • GridCellSizeMode – this property is an enum with 2 possible values: GridCellSizeMode.GridBased and GridCellSizeMode.CellBased. If set to the first the maximal size of a node in the graph is determined and all cells are scaled to that size. More area efficient is the second value - it causes the dimensions of each column and row dimensions to be determined according to the size of the cells they contain. See the pictures below for an example of the aforementioned cell sizing scenarios.

    Grid Based Cell Sizing

    Fig. 3
    Cell Based Cell Sizing

    Fig. 4


  • CellSpacing – determines the distance between 2 grid cells. For example if a grid cell is calculated to have a size of 100 x 100 and the CellSpacing property is set to 10, then the cell size will be 120 x 120. Note that the node is always placed in the middle of the cell.

Conclusion

Orthogonal graph layout
Orthogonal Graph Layout Gallery

Nevron Orthogonal Graph Layout is a powerful layout algorithm that can handle any kind of graph and produce a nice drawing of it in linear time. The layout is integrated in Nevron Diagram for .NET thus giving you the power to layout any diagram on an orthogonal grid using only a few lines of code.

Besides the robust and highly optimized implementation of the Orthogonal Graph Layout, Nevron Diagram for .NET provides a dozen of other well implemented and carefully tested layout algorithms. If we take in mind all these layouts, the high number of examples and the detailed programmers’ documentation provided by Nevron, we may conclude that the professional visualization of complex graphs and diagrams has never been easier.

More information on Orthogonal Graph Layout is available in the Users Guide shipped with the fully-functional evaluation of the Diagram for .NET.

About Nevron Software

Founded in 1998, Nevron Software is a component vendor specialized in the development of premium presentation layer solutions for .NET based technologies. Today Nevron has established itself as the trusted partner worldwide for use in .NET LOB applications, SharePoint portals and Reporting solutions. Nevron technology is used by many Fortune 500 companies, large financial institutions, global IT consultancies, academic institutions, governments and non-profits.
For more information, visit: www.nevron.com.

Customer Quotes:

QUOTE I have just finished an upgrade to one of our Windows based Analytic products where the Nevron Diagram for Windows Forms is an integral component. Listings of numerous related objects were brought to life in diagram form. As a developer I especially appreciated the excellent demonstration program. This program provided windows forms that highlighted many of the products features and provided an easy way to drill down to the sample code (great job). Looking forward to experimenting with the product in the future to bring a richer user interface to our customers. UNQUOTE

Rich Harrigan, Software Engineer
NCR Corporation