Nevron Chart for SQL Server Reporting Services - 2017 Vol.1 Release
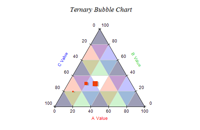
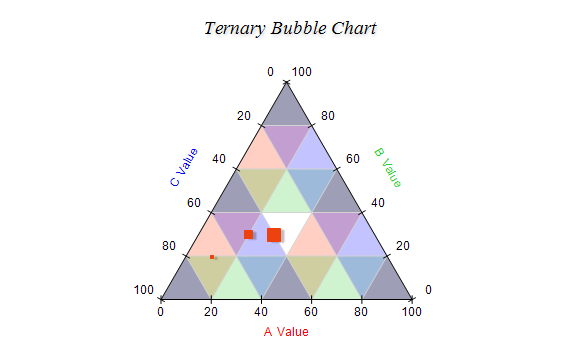
New Ternary Char Type
This feature allows you to display Ternary Point and Ternary Bubble series inside a ternary chart. A ternary chart is type of plot on three variables which sum to a constant.
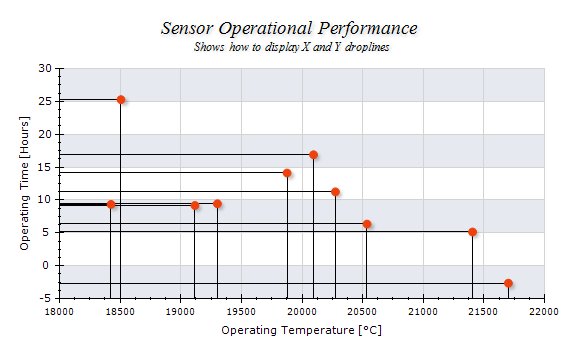
New Point Series Dropline
The Point Series now support drop lines. Drop lines are lines which extend from the point X, Y, Z value to the chart walls. Optionally drop lines can extend to the axis Min, Max value or to a user specified value (drop lines origin).
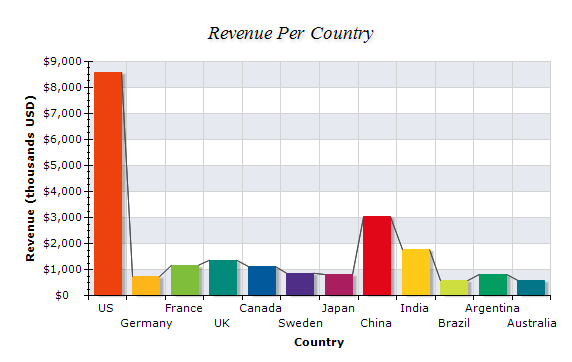
New Bar Connect Lines
The Bar Series now support connector lines between adjacent bars.
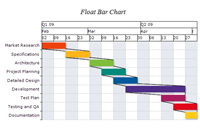
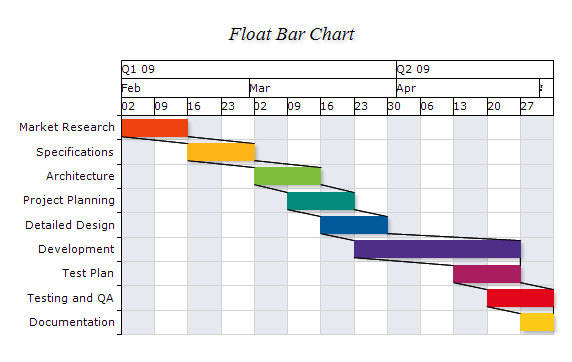
New Float Bar Connector Lines
The Float Bar Series now support connector lines between adjacent bars begin / end values.
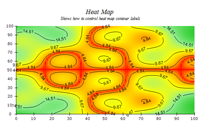
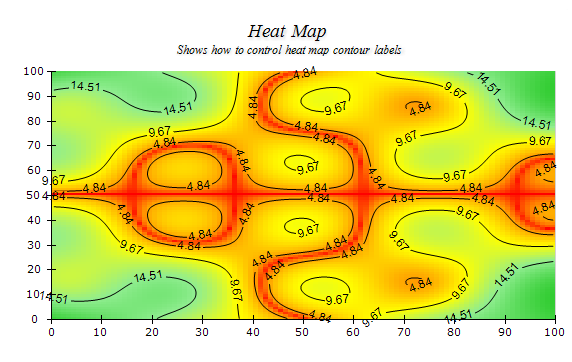
New Heat Map Contour Lines
The Heat Map Series supports annotated contours. The user can specify the formatting of the contour value (elevation). The distance between labels along the contour, whether the labels orientation must follow the contour slope, whether the label should clip the contour line it annotates and others.
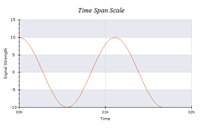
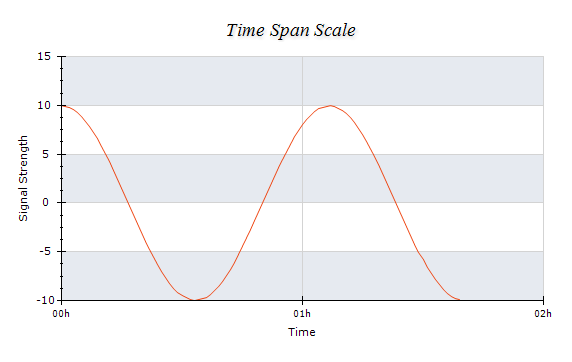
Time Span Scale
This type of scale allows you to display duration of time (time span) (usually on the X Axis). The duration is specified in time spans or ticks.
We needed a solution that could produce a bar graph with overlaid SEM bars. After some research, we determined that Nevron Chart for SSRS component was the right fit, allowing us to easily produce a graph such as this.
Nevron has been very helpful and responsive to our needs. We are pleased with the product and hope to expand its use in our systems in the future.
David Miller, Manager Software Development
Medical Council of Canada