
ProductsAll Products
.NET Components
 Open Vision for .NET
 NOV Chart for .NET
 NOV Diagram for .NET
 NOV Rich Text Editor for .NET
 NOV Grid for .NET
 NOV Schedule for .NET
 NOV Gauge for .NET
 NOV Barcode for .NET
 NOV User Interface for .NET
 Vision for .NET
 Chart for .NET
 Diagram for .NET
 User Interface for .NET
 Vision for SSRS
 Chart for SSRS
 Gauge for SSRS
 Map for SSRS
 Barcode for SSRS
 Vision for SharePoint
 Chart for SharePoint
 Gauge for SharePoint
 Map for SharePoint
 Barcode for SharePoint
DownloadsAll Downloads
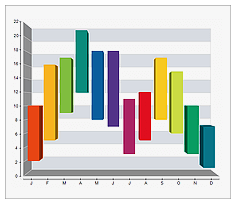
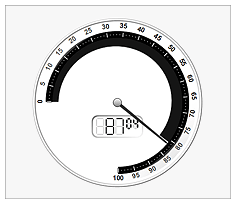
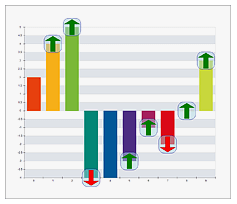
The WPF Chart component supports virtually all 2D and 3D charting types and is suitable for a wide range of applications including business, scientific, statistical, financial, real time monitoring, measurement, BI and others. In addition it also allows for the visualization of instrumentation panels, such as Linear and Radial Gauges, numeric displays and state indicators, making it suitable for the display of KPI’s or the creation of digital dashboards.
Some of the key features of the WPF Chart control are:

