| | |
 | A standard 3D line chart is a visualization that represents data points interconnected by lines. It's a helpful tool for displaying trends and patterns in data. The chart can be customized with markers of various shapes and fill options to highlight specific data points. This makes it easier for viewers to interpret and understand the presented data. |
|
|
![2d line chart]() | Nevron's 2D line chart with an advanced graphics engine ensures high-quality and clear visualization. To create visually appealing designs, the chart can be stylized with image effects like shadow, glow, bevel/emboss, and lighting. It is a perfect tool for creating visually appealing charts with clarity. |
|
|
![smooth line chart]() | Smooth line charts are a great option to visualize data points with the added benefit of cubic curves, making it easier to identify trends and patterns in the data. Each data point can be highlighted with markers of various shapes and fill options, providing additional clarity to the visualization. With a smooth line chart, your data can be presented in a visually appealing and informative way. |
|
|
![xyz scatter line chart]() | An XYZ line chart is a valuable visualization tool that allows the representation of data series with the non-regular distribution. Data points are not evenly spaced, and the XYZ line chart can accurately depict this irregularity. With this chart, you can visualize how data points are distributed across the x, y, and z axes and detect trends and patterns that might be missed with other chart types. Whether you need to display financial, scientific, or any data requiring an XYZ coordinate system, this chart is an excellent choice. |
|
|
![datetime step line chart]() | Date-Time Step Line Chart is a valuable line chart for displaying data measured over time. It uses a stepped line to show changes in data points at regular intervals, such as hourly or daily. This chart is handy for visualizing trends and patterns in data collected over a long period. The Date-Time Step Line Chart allows you to see the general direction of the movement while also showing the specific points at which changes occurred. It is a powerful tool for making data-driven decisions and communicating important information to others. |
|
|
![stacked line chart]() | A stacked line chart is powerful, allowing you to present cumulative data clearly and concisely. This chart lets you see how each category contributes to the total value. Stacked line series is particularly useful when tracking changes in multiple categories over time and visualizing their cumulative impact. By stacking the lines on top of each other, you can easily see which categories are growing or declining and how they affect the overall trend. With stacked line charts, you can present complex data in an informative and visually appealing way. |
|
|
![overlapped line chart]() | The Overlapped Lines Chart is a powerful visualization chart that displays multiple line series in the 3D space as overlapping planes. This creates a clear and concise presentation of data that viewers can easily interpret. The chart is particularly useful when comparing data sets with similar or overlapping trends. With Nevron's advanced graphics engine, you can create professional-quality Overlapped Lines Charts that are visually appealing and easy to read. |
|
|
![multiseries line chart]() | The multiseries line chart is an effective way to display a large amount of data series simultaneously, allowing you to easily compare and contrast the trends of each series. Positioning the line series in different depth spaces allows you to comprehensively overview the relationships between different data sets. This approach can provide valuable insights into complex data, enabling you to make informed decisions based on the trends and patterns you identify. With Nevron's graphics engine, creating a multiseries line chart that is visually appealing and highly functional is easy and straightforward. |
|
|
![Lorenz attractor xyz line chart]() | An XYZ Line Chart can be used to visualize the Lorenz Attractor, a complex fractal structure that represents the long-term behavior of a chaotic 3-dimensional dynamical system. This chart provides a powerful tool for analyzing and understanding the evolving nature of this system without ever crossing itself. |
|
|
![3d step line chart]() | A 3D Step Line Chart is a powerful chart for visualizing complex data. With a dimension scale X-axis, this chart lets you easily track changes over time. The step line chart series display data points connected with HV segments, creating a clear and easy-to-read visualization. Markers with various shapes and fill options can be used for each data point, allowing you to highlight important data and trends. Whether you're working with financial data, scientific research, or any other data type, the 3D Step Line Chart is valuable for gaining insights and making informed decisions. |
|
| |
A line chart is a popular visualization tool that displays value changes over time or any other continuous progression.
It uses points connected by line segments to depict trends and patterns in data. Line charts commonly track stock market trends,
weather patterns, website traffic, and other metrics that change over time.
Line charts are helpful when analyzing trends and patterns in data over a continuous period. They effectively show how data changes
over time, how trends emerge, and how they fluctuate. Line charts can also reveal sudden changes or sharp dips in the data, which may
be missed in other charts.
Line charts are beneficial when there are many data points and multiple data series to compare. They can be customized to include various
lines on the same chart, with different colors and labels for each line. This allows for easy comparison of different data sets and trends.
In summary, line charts are an excellent tool for visualizing trends and changes in data over time or any other continuous progression.
They are beneficial when analyzing complex data sets with multiple data series and can help identify patterns and fluctuations that might not be
visible in different charts.
|
Date | Sales Revenue | Expenses |
---|
2021-01-01 | 1000 | 500 | 2021-02-01 | 1200 | 550 | 2021-03-01 | 1300 | 600 |
In this example, the first column represents the date, the second column represents the sales revenue in USD,
and the third column represents the expenses in USD. Using this data, a line chart could be created to visualize the sales revenue and expenses trend.
|
Selecting the proper measurement interval
Selecting the appropriate measurement interval is crucial when creating a line chart. The measurement interval, or bin size, should be sufficiently broad and short,
as this can result in hiding the helpful signal or revealing only noise. It's best to test out different intervals or rely on domain knowledge to make an informed decision.
Using multiple lines, one for a fine-grained interval and another for the overall trend can also be useful. This can involve averaging over a rolling window to obtain a clearer picture of the data trend.
Do not overload it with too many lines
To prevent clutter and make the line chart easily interpretable, limiting the number of lines plotted is crucial. It's recommended to keep the number of lines to five or fewer. Too many lines on a chart make reading and understanding the data trends difficult.
But if the lines are distinct and separated, it's possible to include more lines while maintaining the chart's readability.
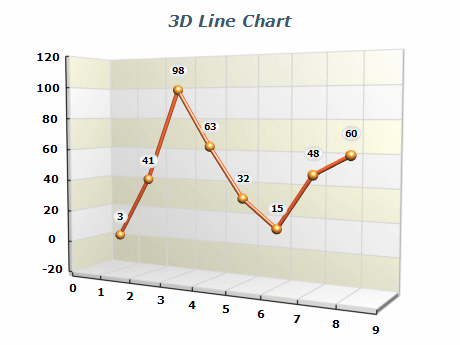
Use colors and markers effectively
Using colors and markers effectively is key to creating a visually appealing and informative line chart. Colors can differentiate between multiple lines or data sets,
making it easier for viewers to identify and track specific trends. Markers can be utilized to draw attention to particular data points or trends, emphasizing their
significance in the overall pattern.
It is essential to select appropriate colors and markers that complement each other and are easily distinguishable, ensuring that the chart remains straightforward and
easy to interpret. |
|