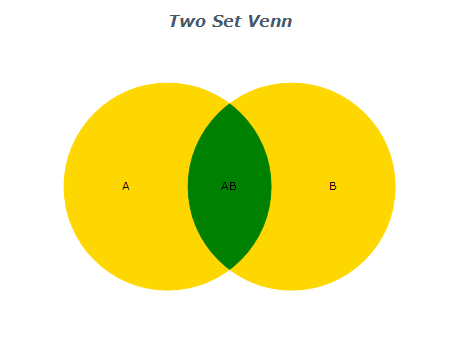
| | |
 | Venn charts visually depict the logical relationships between sets of objects using partially overlapping ellipses. They can show two or more sets and the areas of overlap between them. For instance, a Venn diagram with two sets typically comprises two partially overlapping ellipses. This visualization tool can help identify commonalities and differences among data sets, aiding decision-making and analysis. |
|
|
![three set venn diagram]() | The three-set Venn diagram consists of three overlapping ellipses representing three data sets or variables. Each circle represents a set, and the area of overlap between the ellipses represents the intersection of the sets.
This chart type is commonly used to illustrate relationships between three groups or categories: customer demographics, product features, or market segments. The diagram allows you to easily visualize how the sets intersect and overlap, providing valuable insights into the relationships between the data. |
|
|
![four set venn diagram]() | This chart type is commonly used in mathematics, statistics, and data analysis to visualize complex relationships between four groups or categories. Using a four-set Venn diagram, you can easily understand and analyze the relationships between the data and identify patterns and insights that may not be immediately apparent from other types of data visualization. |
|
|
![five set venn diagram]() | A five-set Venn diagram is a versatile and powerful chart type used in various fields, including mathematics, statistics, and data analysis. It helps to visualize the relationships between five different sets of data or variables, making it easier to identify patterns and insights that may not be immediately apparent from other types of data visualization.
One of the most common use cases for a five-set Venn diagram is in market analysis. For example, a business may use this type of chart to analyze the characteristics of their customers, such as age, gender, income, location, and interests. By creating a five-set Venn diagram, they can quickly identify the overlap between these characteristics, providing insights into which groups of customers have the most significant impact on their business. |
|
| |
Venn charts are an essential charting type that can visually represent the logical relationships between sets of objects. These diagrams consist of two or more partially overlapping ellipses, each representing a set. The overlapping region between the ellipses shows the common elements shared by the sets. Venn diagrams are widely used in data analysis, statistics, and research to display the relationships and similarities between different groups. With their intuitive and straightforward design, Venn diagrams are a powerful tool for data visualization and can provide valuable insights into complex data sets. |
Set A | Set B | Overlap |
---|
10 | 20 | 5 | 5 | 15 | 2 | 8 | 12 | 4 |
A Venn diagram can be constructed using this table by drawing two overlapping circles to represent Set A and Set B, respectively. The size of each circle can be proportional to the range of values it represents, and the overlapping region can be shaded to represent the number of values that overlap between them. The diagram can help visually compare each set's sizes and their intersection, providing insights into the relationship between the two sets.
|
- Clearly define the sets: It's important to define the sets and their relationships before creating a Venn chart. This ensures that the chart accurately represents the relationships between the sets.
- Limit the number of sets: Venn diagrams can become difficult to interpret if there are too many sets. Limiting the number of sets to three or four is recommended, depending on the relationships' complexity.
- Use consistent shapes and colors: Use consistent shapes and colors for each set to ensure the chart is easy to read and understand.
- Label the sets and intersections: Labeling the sets and intersections helps the viewer understand the relationships between the sets. It's important to use clear and concise labels that accurately describe the sets and their relationships.
- Avoid using too much text: Venn diagrams are intended to visually represent the relationships between sets. Avoid using too much text, as it can clutter the chart and make it difficult to read.
|
|