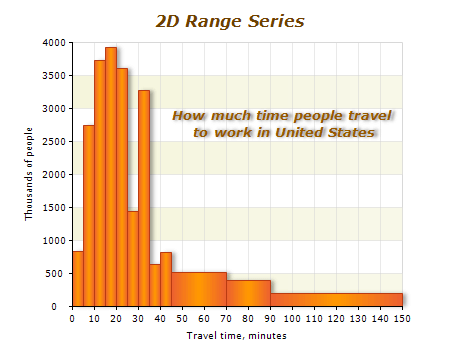
Range charts are types of charts that use 2D or 3D shapes defined by the beginning and end values of their bounding boxes. They are versatile tools that can be used to display histograms, bars with custom sizes, and 3D ranges, among other things.
With Range charts, you can easily define display 2D and 3D range by simply specifying their begin end values in the X, Y, and Z direction.