The Polynomial Regression is a form of linear regression in which the relationship between the independent variable x and the dependent variable y is modelled as an nth degree polynomial. Polynomial regression fits a nonlinear relationship between the value of x and the corresponding conditional mean of y, denoted E(y | x), and has been used to describe nonlinear phenomena such as the growth rate of tissues, the distribution of carbon isotopes in lake sediments, and the progression of disease epidemics.
Nevron Chart for SQL Reporting Services (SSRS) provides advanced support for drawing Polynomial Trend Lines. The Polynomial Trend Line calculates the polynomial regression of the master series values. The calculation takes into account the X values of master series. You have the option to control the polynomial order and thus create polynomial interpolations of second, third and higher degrees.
You can easily add Polynomial Trend Line to your Nevron Charts in Reporting Services by following these steps:
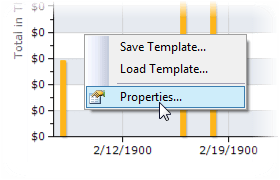
1. Right-click on the Nevron Chart report item and select Properties to run the Chart Designer:
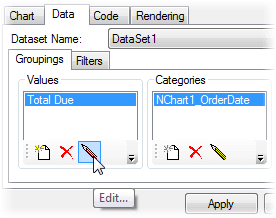
2. Go to the Data tab and under the Groupings -> Values, Edit the values for the master series for which you will be plotting the Polynomial:
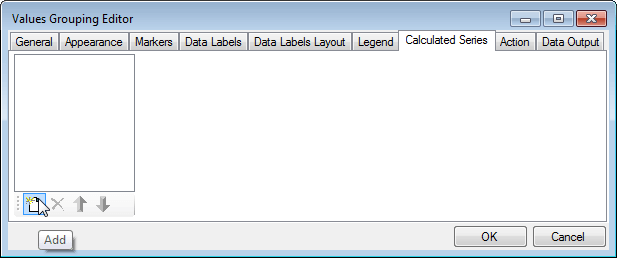
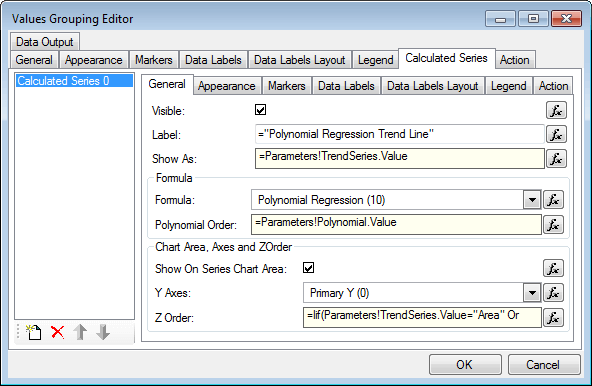
3. In the Values Grouping Editor, go to the Calculated Series tab and click on the Add button to add a new Calculated Series:
4. Provide a name for the calculated series and select Polynomial Regression (10) from the Formula field:
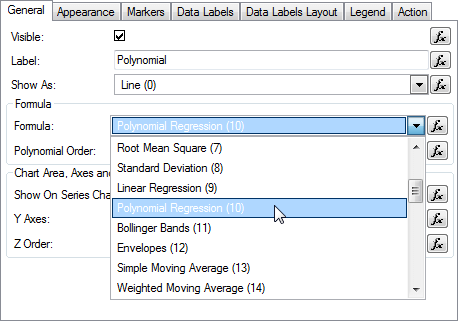
5. From the properties associated with the Polynomial, you can specify the series type (Line, Smooth Line, Area, or Smooth Area), the Polynomial Order (the Degree of the Polynomial), display on Chart Area, Axes, Z Order, as well as other appearance and styling options. All properties of the Polynomial Trend Line can parametrized by using expressions. For example, this can help you easily see the changes of the Polynomial with a 2nd degree, 3rd degree, or higher order.
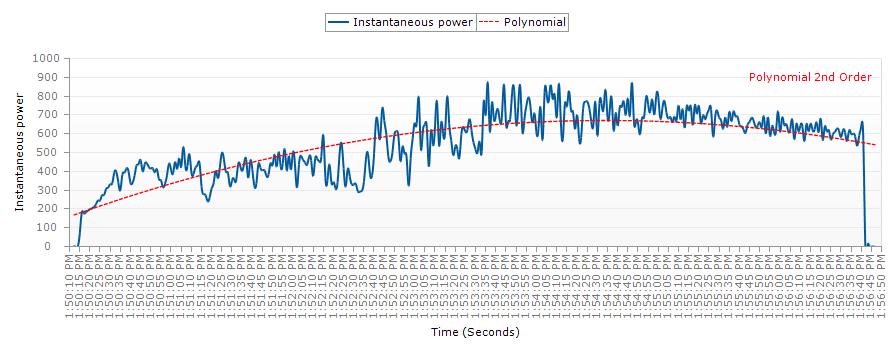
6. Click OK to save your changes and run your report to preview the Polynomial Trend Line:
Polynomial 2nd Order:
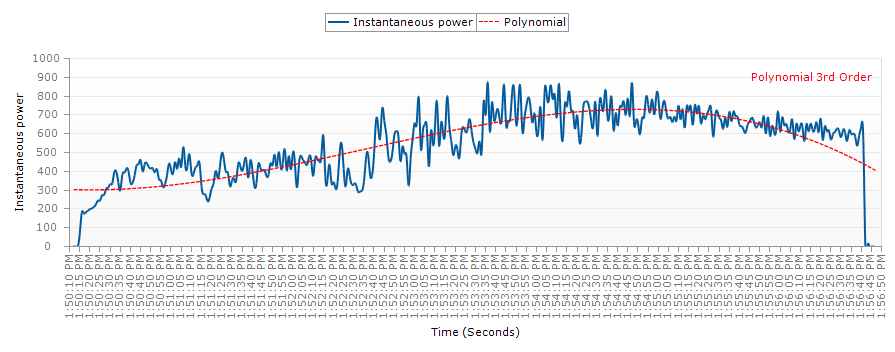
Polynomial 3rd Order:
You can download the example RDL report from the following link:
Polynomial Trend Line in SSRS
To run the RDL you need to have the Nevron Vision for SSRS installed on your report development machine.