Imports Nevron.Nov
Imports Nevron.Nov.Chart
Imports Nevron.Nov.Dom
Imports Nevron.Nov.Graphics
Imports Nevron.Nov.Layout
Imports Nevron.Nov.Text
Imports Nevron.Nov.UI
Imports Nevron.Nov.Windows.Forms
Imports System

Public Class Form1

#Region "Constructors"

    Public Sub New()
        ' This call is required by the designer.
        InitializeComponent()

        ' Add any initialization after the InitializeComponent() call.

        ' Set form title
        Text = "NOV WinForms - NSampleReport2Example"

        ' Create the NOV example and its controls
        Dim exampleContent As NWidget = CreateExampleContent()
        Dim exampleControls As NWidget = CreateExampleControls()
        If Not exampleControls Is Nothing Then
            exampleControls.PreferredWidth = 300
        End If

        ' Place the example and its controls in a pair box
        Dim pairBox As NPairBox = New NPairBox(exampleContent, exampleControls)
        pairBox.FillMode = ENStackFillMode.First
        pairBox.FitMode = ENStackFitMode.First
        pairBox.Margins = New NMargins(NDesign.HorizontalSpacing, NDesign.VerticalSpacing)

        ' Host the example in the form
        Dim host As NNovWidgetHost(Of NWidget) = New NNovWidgetHost(Of NWidget)(pairBox)
        host.Dock = DockStyle.Fill
        Controls.Add(host)
    End Sub


#End Region

#Region "Example"

        Public Function CreateExampleContent() As NWidget
            ' Create the rich text
            Dim richTextWithRibbon As NRichTextViewWithRibbon = New NRichTextViewWithRibbon()
            m_RichText = richTextWithRibbon.View
            m_RichText.AcceptsTab = True
            m_RichText.Content.Sections.Clear()

            ' Populate the rich text
            PopulateRichText()

            Return richTextWithRibbon
        End Function
        Public Function CreateExampleControls() As NWidget
            Dim stack As NStackPanel = New NStackPanel()

            Dim highlightAllChartsButton As NButton = New NButton("Highlight All Charts")
            highlightAllChartsButton.Click += AddressOf OnHighlightAllChartsButtonClick
            stack.Add(highlightAllChartsButton)

            Return stack
        End Function
        Public Function GetExampleDescription() As String
            Return "
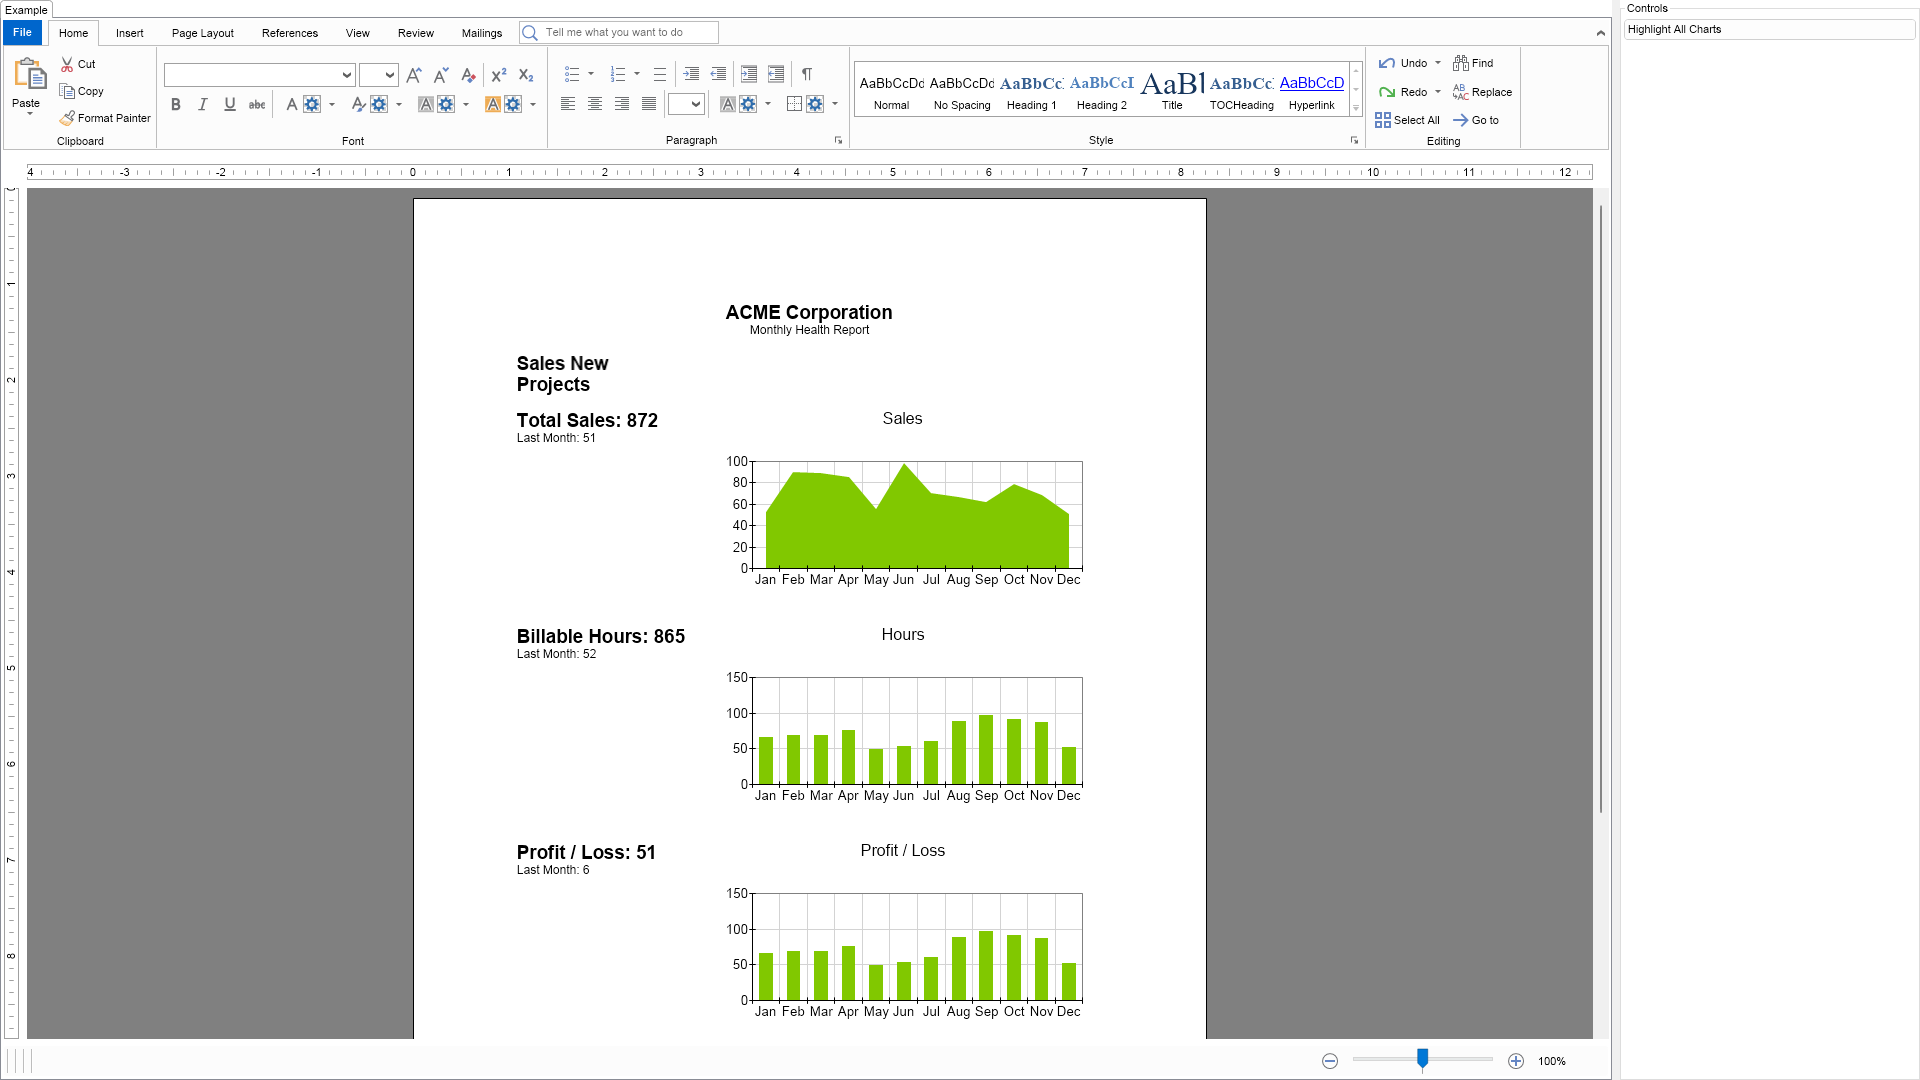
This example demonstrates how to programmatically create reports as well as how to collect text elements of different type.
"
        End Function

        '''
        ''' Gets the relevant documentation links for the example
        '''
        '''
        Public Function GetDocumentationUrls() As (String, String)()
            Return {("Rich Text Tables", "https://www.nevron.com/docs/openvision/rich-text-tables.html"), ("Rich Text Paragraphs", "https://www.nevron.com/docs/openvision/rich-text-paragraphs.html"), ("Rich Text Sections", "https://www.nevron.com/docs/openvision/rich-text-sections.html"), ("Rich Text Image Inlines", "https://www.nevron.com/docs/openvision/rich-text-image-inlines.html"), ("Rich Text Field Inlines", "https://www.nevron.com/docs/openvision/rich-text-field-inlines.html")}
        End Function

        Private Sub PopulateRichText()
            Dim section As NSection = New NSection()
            m_RichText.Content.Sections.Add(section)

            Dim paragraph As NParagraph = New NParagraph()

            paragraph.HorizontalAlignment = ENAlign.Center
            paragraph.Inlines.Add(CreateHeaderText("ACME Corporation"))
            paragraph.Inlines.Add(New NLineBreakInline())
            paragraph.Inlines.Add(CreateNormalText("Monthly Health Report"))

            section.Blocks.Add(paragraph)

            ' generate sample data
            Dim sales = New Double(11) {}
            Dim hours = New Double(11) {}
            Dim profitloss = New Double(11) {}
            Dim months = New String() {"Jan", "Feb", "Mar", "Apr", "May", "Jun", "Jul", "Aug", "Sep", "Oct", "Nov", "Dec"}
            Dim random As Random = New Random()

            For i = 0 To 11
                sales(i) = 50 + random.Next(50)
                hours(i) = 50 + random.Next(50)
                profitloss(i) = 25 - random.Next(50)
            Next

            Dim table As NTable = New NTable()
            section.Blocks.Add(table)

            table.Columns.Add(New NTableColumn())
            table.Columns.Add(New NTableColumn())

            If True Then
                Dim tableRow As NTableRow = New NTableRow()

                Dim tableCell1 As NTableCell = New NTableCell()

                Dim par1 As NParagraph = New NParagraph()
                par1.Inlines.Add(CreateHeaderText("Sales New Projects"))
                tableCell1.Blocks.Add(par1)
                tableRow.Cells.Add(tableCell1)

                Dim tableCell2 As NTableCell = New NTableCell()
                tableCell2.Blocks.Add(New NParagraph())
                tableRow.Cells.Add(tableCell2)

                table.Rows.Add(tableRow)
            End If

            If True Then
                Dim tableRow As NTableRow = New NTableRow()

                Dim tableCell1 As NTableCell = New NTableCell()

                Dim par1 As NParagraph = New NParagraph()
                par1.Inlines.Add(CreateHeaderText("Total Sales: " & GetTotal(sales).ToString()))
                par1.Inlines.Add(New NLineBreakInline())
                par1.Inlines.Add(CreateNormalText("Last Month: " & sales(11).ToString()))
                tableCell1.Blocks.Add(par1)
                tableRow.Cells.Add(tableCell1)

                Dim tableCell2 As NTableCell = New NTableCell()
                tableCell2.Blocks.Add(CreateBarChart(True, New NSize(400, 200), "Sales", sales, months))
                tableRow.Cells.Add(tableCell2)

                table.Rows.Add(tableRow)
            End If

            If True Then
                Dim tableRow As NTableRow = New NTableRow()

                Dim tableCell1 As NTableCell = New NTableCell()

                Dim par1 As NParagraph = New NParagraph()
                par1.Inlines.Add(CreateHeaderText("Billable Hours: " & GetTotal(hours).ToString()))
                par1.Inlines.Add(New NLineBreakInline())
                par1.Inlines.Add(CreateNormalText("Last Month: " & hours(11).ToString()))
                tableCell1.Blocks.Add(par1)
                tableRow.Cells.Add(tableCell1)

                Dim tableCell2 As NTableCell = New NTableCell()
                tableCell2.Blocks.Add(CreateBarChart(False, New NSize(400, 200), "Hours", hours, months))
                tableRow.Cells.Add(tableCell2)

                table.Rows.Add(tableRow)
            End If

            If True Then
                Dim tableRow As NTableRow = New NTableRow()

                Dim tableCell1 As NTableCell = New NTableCell()

                Dim par1 As NParagraph = New NParagraph()
                par1.Inlines.Add(CreateHeaderText("Profit / Loss: " & GetTotal(profitloss).ToString()))
                par1.Inlines.Add(New NLineBreakInline())
                par1.Inlines.Add(CreateNormalText("Last Month: " & profitloss(11).ToString()))
                tableCell1.Blocks.Add(par1)
                tableRow.Cells.Add(tableCell1)

                Dim tableCell2 As NTableCell = New NTableCell()
                tableCell2.Blocks.Add(CreateBarChart(False, New NSize(400, 200), "Profit / Loss", hours, months))
                tableRow.Cells.Add(tableCell2)

                table.Rows.Add(tableRow)
            End If
        End Sub

#End Region

#Region "Implementation"
#End Region

#Region "Event Handlers"

        Private Sub OnHighlightAllChartsButtonClick(arg As NEventArgs)


            Dim charts = m_RichText.Content.GetDescendants(NChartView.NChartViewSchema)

            For i = 0 To charts.Count - 1
                Dim chartView = CType(charts(i), NChartView)

                CType(chartView.Surface.Charts(0), NCartesianChart).PlotFill = New NColorFill(NColor.LightBlue)
            Next
        End Sub


#End Region

#Region "Fields"

        Private m_RichText As NRichTextView

#End Region

#Region "Static Methods"

        Private Shared Function GetTotal(values As Double()) As Double
            Dim total = 0.0

            For i = 0 To values.Length - 1
                total += values(i)
            Next

            Return total
        End Function
        Private Shared Function CreateHeaderText(text As String) As NTextInline
            Dim inline As NTextInline = New NTextInline(text)

            inline.FontSize = 14
            inline.FontStyle = ENFontStyle.Bold

            Return inline
        End Function
        Private Shared Function CreateNormalText(text As String) As NTextInline
            Dim inline As NTextInline = New NTextInline(text)

            inline.FontSize = 9

            Return inline
        End Function

        '''
        ''' Creates a sample bar chart given title, values and labels
        '''
        '''
        '''
        '''
        '''
        '''
        '''
        Private Shared Function CreateBarChart(area As Boolean, size As NSize, title As String, values As Double(), labels As String()) As NParagraph
            Dim chartView As NChartView = New NChartView()

            chartView.Surface.CreatePredefinedChart(ENPredefinedChartType.Cartesian)
            chartView.PreferredSize = size

            ' configure title
            chartView.Surface.Titles(0).Text = title
            chartView.Surface.Titles(0).Margins = NMargins.Zero
            chartView.Surface.Legends(0).Visibility = ENVisibility.Hidden
            chartView.BorderThickness = NMargins.Zero

            ' configure chart
            Dim chart = CType(chartView.Surface.Charts(0), NCartesianChart)
            chart.Padding = New NMargins(20)
            chart.Margins = NMargins.Zero

            If area Then
                Dim areaSeries As NAreaSeries = New NAreaSeries()
                areaSeries.LegendView.Mode = ENSeriesLegendMode.None
                areaSeries.DataLabelStyle = New NDataLabelStyle(False)

                chart.Series.Add(areaSeries)

                For i = 0 To values.Length - 1
                    areaSeries.DataPoints.Add(New NAreaDataPoint(values(i)))
                Next
            Else
                Dim barSeries As NBarSeries = New NBarSeries()
                barSeries.LegendView.Mode = ENSeriesLegendMode.None
                barSeries.DataLabelStyle = New NDataLabelStyle(False)

                chart.Series.Add(barSeries)

                For i = 0 To values.Length - 1
                    barSeries.DataPoints.Add(New NBarDataPoint(values(i)))
                Next
            End If

            Dim scaleX As NOrdinalScale = chart.Axes(ENCartesianAxis.PrimaryX).Scale
            scaleX.Labels.TextProvider = New NOrdinalScaleLabelTextProvider(labels)
            scaleX.MajorTickMode = ENMajorTickMode.CustomStep
            scaleX.CustomStep = 1

            Dim paragraph As NParagraph = New NParagraph()

            Dim chartInline As NWidgetInline = New NWidgetInline()
            chartInline.Content = chartView
            paragraph.Inlines.Add(chartInline)

            Return paragraph
        End Function

#End Region

#Region "Constants"
#End Region

#Region "Nested Types"
#End Region

End Class

 Chart for .NET
 Diagram for .NET
 User Interface for .NET
 Vision for SSRS
 Chart for SSRS
 Gauge for SSRS
 Map for SSRS
 Barcode for SSRS
 Vision for SharePoint
 Chart for SharePoint
 Gauge for SharePoint
 Map for SharePoint
 Barcode for SharePoint
 Open Vision for .NET


 Vision for .NET