The new release of Nevron Chart for .NET comes with great new features to extend the data visualization capabilities of the most advanced .NET charting component.
Following is a list of the new features and improvements introduced in the 2019.1 release:
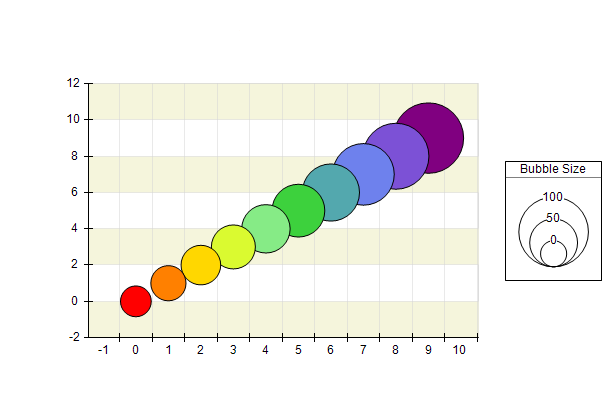
Added support for non - normalized bubble min max sizes. This allows to you display bubbles with smaller data size as larger bubbles on the screen and vice versa.
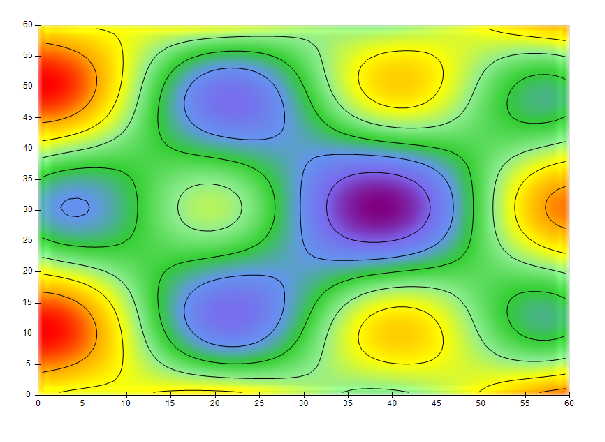
Added property InterpolateImageEdges to control the way heat maps scale to the edge. Improved heat map contour generation.
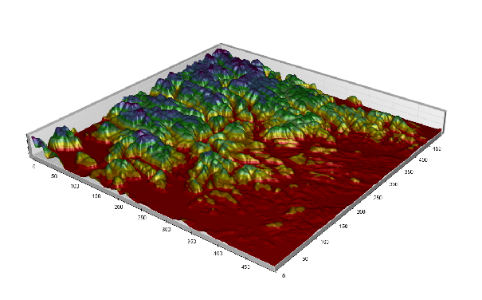
Added support for conversion of triangulated to grid data (binning) using the grid surface data InitFromPoints method.
Added property for showing the label connectors begin cap - ShowLabelConnectorBeginCap property
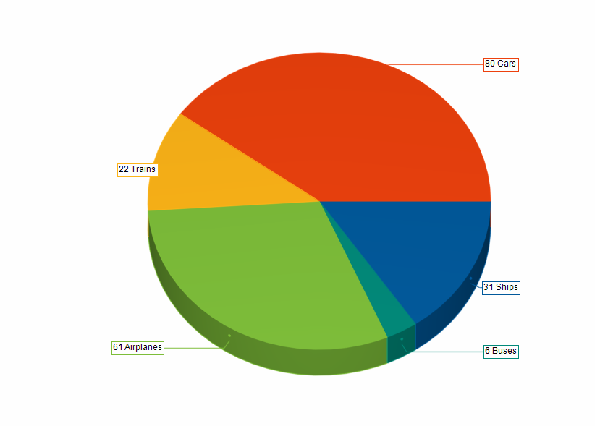
Added property for centering the pie series when in spider non overlap move - CenterPie property
Nevron Vision for .NET now provides full support for Visual Studio 2019!