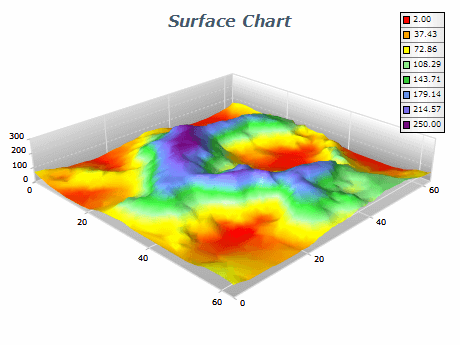
The Triangulated Surface Chart is a powerful visualization tool that displays three-dimensional data sets using a mesh of triangles to represent the surface of the data. It does so by constructing a Delaunay triangular network from the incoming data. This type of triangular is unique for each data set and aims to minimize the minimum angles of the contained triangles. This allows for optimal representation of the generated surface.
The Triangulated Surface provides various options, including smooth and flat shading, custom color per vertex, palette filling, and others.