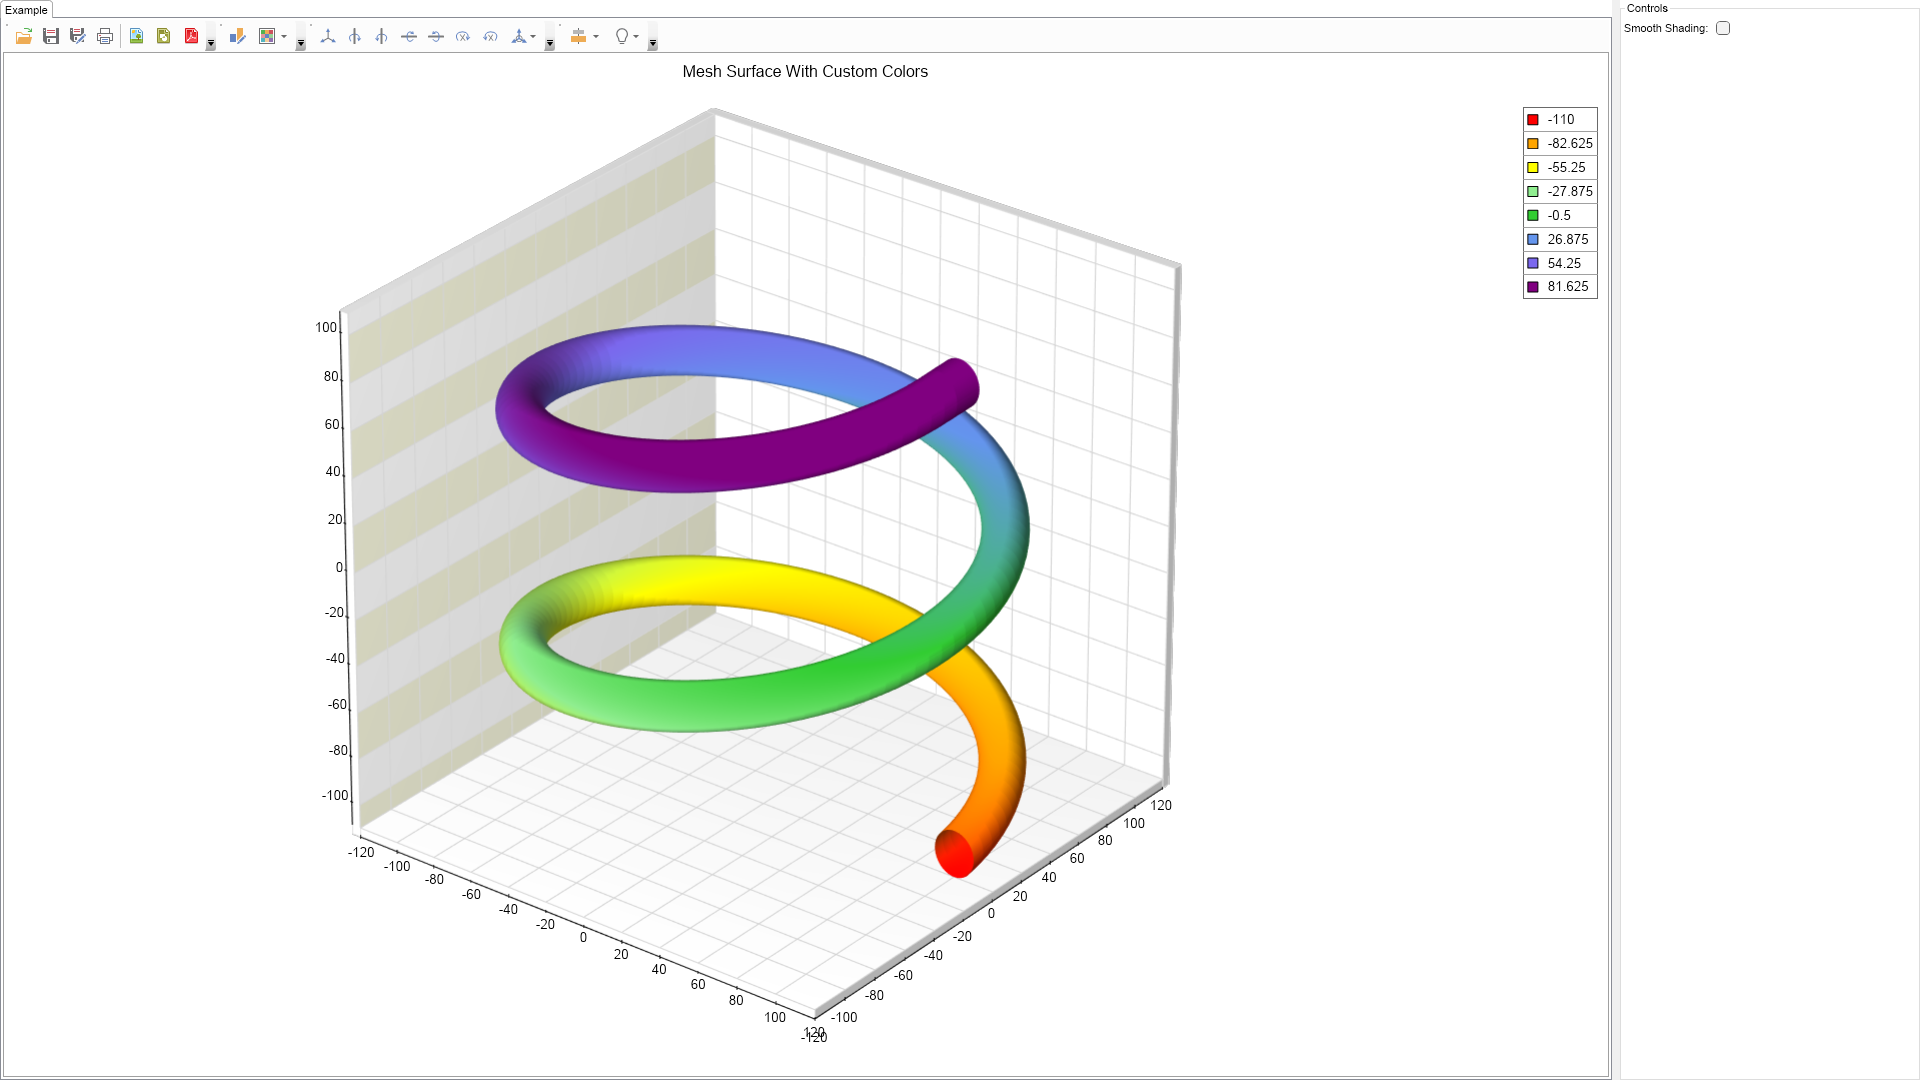
Mesh Surface Custom Colors Example for WPF

Nevron NOV Chart for WPF ships with hundreds of examples with full source code, as part of the Nevron Open Vision Suite. All WPF Chart examples are also available as a stand-alone Visual Studio solution in C# and VB.NET, which you can download from the links below.

Mesh Surface Custom Colors Example for WPF Description

The example demonstrates the ability of the Mesh Surface Series to assign custom color per each individual surface vertex.


Mesh Surface Custom Colors Example

C# Mesh Surface Custom Colors Example Code for Nevron Chart for WPF
Language: C#

using Nevron.Nov;
using Nevron.Nov.Chart;
using Nevron.Nov.Chart.Tools;
using Nevron.Nov.Dom;
using Nevron.Nov.Graphics;
using Nevron.Nov.Layout;
using Nevron.Nov.UI;
using Nevron.Nov.Windows.Forms;
using System;
using System.Windows.Forms;

namespace NovWinFormsProject
{
	public partial class Form1 : Form
	{
		#region Constructors

		public Form1()
		{
			InitializeComponent();

			// Set form title
			Text = "NOV WinForms - NMeshSurfaceCustomColorsExample";

			// Create the NOV example and its controls
			NWidget exampleContent = CreateExampleContent();
			NWidget exampleControls = CreateExampleControls();
			if (exampleControls != null)
			{
				exampleControls.PreferredWidth = 300;
			}

			// Place the example and its controls in a pair box
			NPairBox pairBox = new NPairBox(exampleContent, exampleControls);
			pairBox.FillMode = ENStackFillMode.First;
			pairBox.FitMode = ENStackFitMode.First;
			pairBox.Margins = new NMargins(NDesign.HorizontalSpacing, NDesign.VerticalSpacing);

			// Host the example in the form
			NNovWidgetHost host = new NNovWidgetHost(pairBox);
			host.Dock = DockStyle.Fill;
			Controls.Add(host);
		}

		#endregion

		#region Example

		public NWidget CreateExampleContent()
		{
			NChartViewWithCommandBars chartViewWithCommandBars = new NChartViewWithCommandBars();
			NChartView chartView = chartViewWithCommandBars.View;
			chartView.Surface.CreatePredefinedChart(ENPredefinedChartType.Cartesian);

            // configure title
            chartView.Surface.Titles[0].Text = "Mesh Surface With Custom Colors";

            // setup chart
            NCartesianChart chart = (NCartesianChart)chartView.Surface.Charts[0];
            m_Chart = chart;

            chart.Enable3D = true;
            chart.ModelWidth = 55.0f;
            chart.ModelDepth = 55.0f;
            chart.ModelHeight = 55.0f;
            chart.Projection.SetPredefinedProjection(ENPredefinedProjection.PerspectiveTilted);
            chart.LightModel.SetPredefinedLightModel(ENPredefinedLightModel.SoftTopLeft);
            chart.Interactor = new NInteractor(new NTrackballTool());

            NLinearScale scale = (NLinearScale)chart.Axes[ENCartesianAxis.PrimaryY].Scale;
            scale.ViewRangeInflateMode = ENScaleViewRangeInflateMode.None;

            // setup axes
            NLinearScale scaleX = new NLinearScale();
            chart.Axes[ENCartesianAxis.PrimaryX].Scale = scaleX;
            scaleX.MajorGridLines.SetShowAtWall(ENChartWall.Bottom, true);
            scaleX.MajorGridLines.SetShowAtWall(ENChartWall.Back, true);

            NLinearScale scaleZ = new NLinearScale();
            chart.Axes[ENCartesianAxis.Depth].Scale = scaleZ;
            scaleZ.MajorGridLines.SetShowAtWall(ENChartWall.Bottom, true);
            scaleZ.MajorGridLines.SetShowAtWall(ENChartWall.Left, true);

            // add interlace stripe to the Y axis
            NLinearScale linearScale = chart.Axes[ENCartesianAxis.PrimaryY].Scale as NLinearScale;
            NScaleStrip stripStyle = new NScaleStrip(new NColorFill(NColor.Beige), null, true, 0, 0, 1, 1);
            stripStyle.Interlaced = true;
            stripStyle.SetShowAtWall(ENChartWall.Back, true);
            stripStyle.SetShowAtWall(ENChartWall.Left, true);
            linearScale.Strips.Add(stripStyle);

            // add the surface series
            m_Surface = new NMeshSurfaceSeries();
            chart.Series.Add(m_Surface);

            m_Surface.Name = "Surface";
            m_Surface.LegendView.Mode = ENSeriesLegendMode.SeriesLogic;
            m_Surface.FillColorMode = ENColorMode.Zone;
            m_Surface.FlatPositionValue = 0.5;
            m_Surface.Data.SetGridSize(20, 20);
            m_Surface.Fill = new NColorFill(NColor.YellowGreen);

            FillData(m_Surface);

            return chartViewWithCommandBars;
        }

        private void FillData(NMeshSurfaceSeries surface)
        {
            int m = 200;
            int n = 100;

            int lastM = m - 1;
            int lastN = n - 1;

            double centerX = 0;
            double centerZ = 0;
            double centerY = 0;

            double radius1 = 100.0;
            double radius2 = 10.0;

            double beginAlpha = 0;
            double endAlpha = NMath.PI2;
            double alphaStep = 2 * NMath.PI2 / m;

            double beginBeta = 0;
            double endBeta = NMath.PI2;
            double betaStep = NMath.PI2 / n;

            NVector2DD[] arrPrecomputedData = new NVector2DD[m];

            for (int i = 0; i < m; i++)
            {
                // calculate the current angle, its cos and sin
                double alpha = (i == lastM) ? (endAlpha) : (beginAlpha + i * alphaStep);

                arrPrecomputedData[i].X = Math.Cos(alpha);
                arrPrecomputedData[i].Y = Math.Sin(alpha);
            }

            int vertexIndex = 0;

            surface.Data.HasColors = true;
            surface.Data.SetGridSize(m, n);

            NColor beginColor = NColor.Red;
            NColor endColor = NColor.Blue;

            float offset = -100;

            for (int j = 0; j < n; j++)
            {
                // calculate the current beta angle
                double beta = (j == lastN) ? (endBeta) : (beginBeta + j * betaStep);
                double fCosBeta = (float)Math.Cos(beta);
                double fSinBeta = (float)Math.Sin(beta);

                offset = -100;

                for (int i = 0; i < m; i++)
                {
                    double fCosAlpha = arrPrecomputedData[i].X;
                    double fSinAlpha = arrPrecomputedData[i].Y;

                    double fx = fCosBeta * radius2 + radius1;

                    double dx = fx * fCosAlpha;
                    double dz = fx * fSinAlpha;
                    double dy = -(fSinBeta * radius2);

                    double x = centerX + dx;
                    double y = centerY + dy + offset;
                    double z = centerZ + dz;

                    offset++;

                    surface.Data.SetValue(i, j, y, x, z);

                    double length = Math.Sqrt(dx * dx + dz * dz + dy * dy);
                    surface.Data.SetColor(i, j, InterpolateColors(beginColor, endColor, i / 100.0f));//(length - (radius1 - radius2)) / radius2));

                    vertexIndex++;
                }
            }
        }

        public static NColor InterpolateColors(NColor color1, NColor color2, float factor)
        {
            if (factor > 1.0f)
                factor = 1.0f;
            else if (factor < 0.0)
                factor = 0.0f;

            int r1 = ((int)color1.R);
            int g1 = ((int)color1.G);
            int b1 = ((int)color1.B);

            int r2 = ((int)color2.R);
            int g2 = ((int)color2.G);
            int b2 = ((int)color2.B);

            byte num7 = (byte)((((float)r1) + (((float)(r2 - r1)) * factor)));
            byte num8 = (byte)((((float)g1) + (((float)(g2 - g1)) * factor)));
            byte num9 = (byte)((((float)b1) + (((float)(b2 - b1)) * factor)));

            return NColor.FromRGB(num7, num8, num9);
        }

        public NWidget CreateExampleControls()
		{
			NStackPanel stack = new NStackPanel();
			NUniSizeBoxGroup group = new NUniSizeBoxGroup(stack);

            NCheckBox smoothShadingCheckBox = new NCheckBox();
            smoothShadingCheckBox.CheckedChanged += OnSmoothShadingCheckBoxCheckedChanged;
            smoothShadingCheckBox.Checked = false;
            smoothShadingCheckBox.HorizontalPlacement = Layout.ENHorizontalPlacement.Left;
            stack.Add(NPairBox.Create("Smooth Shading:", smoothShadingCheckBox));

            return group;
		}

        private void OnSmoothShadingCheckBoxCheckedChanged(NValueChangeEventArgs arg)
        {
            m_Surface.ShadingMode = (bool)arg.NewValue ? ENShadingMode.Smooth : ENShadingMode.Flat;
        }

        public string GetExampleDescription()
		{
			return @"

The example demonstrates the ability of the Mesh Surface Series to assign custom color per each individual surface vertex.

"; } /// /// Gets the relevant documentation links for the example /// /// public (string Name, string Url)[] GetDocumentationUrls() { return new[] { ("Mesh Surface Series", "https://www.nevron.com/docs/openvision/mesh-surface-chart-series.html"), ("chart-palettes", "https://www.nevron.com/docs/openvision/chart-palettes.html"), ("Overview", "https://www.nevron.com/docs/openvision/chart-legeng-overview.html"), }; } #endregion #region Implementation #endregion #region Event Handlers #endregion #region Fields NChart m_Chart; NMeshSurfaceSeries m_Surface; #endregion #region Static Methods #endregion #region Constants #endregion #region Nested Types #endregion } }

Download a fully functional C# (.cs) Mesh Surface Custom Colors Example for WPF Solution

VB.NET Mesh Surface Custom Colors Example Code for Nevron Chart for WPF
Language: VB.NET

Imports Nevron.Nov
Imports Nevron.Nov.Chart
Imports Nevron.Nov.Chart.Tools
Imports Nevron.Nov.Dom
Imports Nevron.Nov.Graphics
Imports Nevron.Nov.Layout
Imports Nevron.Nov.UI
Imports Nevron.Nov.Windows.Wpf
Imports System

Class MainWindow

#Region "Constructors"

	Public Sub New()
		' This call is required by the designer.
		InitializeComponent()

		' Add any initialization after the InitializeComponent() call.

		' Set form title
		Title = "NOV WPF - NMeshSurfaceCustomColorsExample"

		' Create the NOV example and its controls
		Dim exampleContent As NWidget = CreateExampleContent()
		Dim exampleControls As NWidget = CreateExampleControls()
		If Not exampleControls Is Nothing Then
			exampleControls.PreferredWidth = 300
		End If

		' Place the example and its controls in a pair box
		Dim pairBox As NPairBox = New NPairBox(exampleContent, exampleControls)
		pairBox.FillMode = ENStackFillMode.First
		pairBox.FitMode = ENStackFitMode.First
		pairBox.Margins = New NMargins(NDesign.HorizontalSpacing, NDesign.VerticalSpacing)

		' Host the example in the form
		Dim host As NNovWidgetHost(Of NWidget) = New NNovWidgetHost(Of NWidget)(pairBox)
		Content = host
	End Sub


#End Region

#Region "Example"

        Public Function CreateExampleContent() As NWidget
            Dim chartViewWithCommandBars As NChartViewWithCommandBars = New NChartViewWithCommandBars()
            Dim chartView = chartViewWithCommandBars.View
            chartView.Surface.CreatePredefinedChart(ENPredefinedChartType.Cartesian)

            ' configure title
            chartView.Surface.Titles(0).Text = "Mesh Surface With Custom Colors"

            ' setup chart
            Dim chart = CType(chartView.Surface.Charts(0), NCartesianChart)
            m_Chart = chart

            chart.Enable3D = True
            chart.ModelWidth = 55.0F
            chart.ModelDepth = 55.0F
            chart.ModelHeight = 55.0F
            chart.Projection.SetPredefinedProjection(ENPredefinedProjection.PerspectiveTilted)
            chart.LightModel.SetPredefinedLightModel(ENPredefinedLightModel.SoftTopLeft)
            chart.Interactor = New NInteractor(New NTrackballTool())

            Dim scale As NLinearScale = chart.Axes(ENCartesianAxis.PrimaryY).Scale
            scale.ViewRangeInflateMode = ENScaleViewRangeInflateMode.None

            ' setup axes
            Dim scaleX As NLinearScale = New NLinearScale()
            chart.Axes(ENCartesianAxis.PrimaryX).Scale = scaleX
            scaleX.MajorGridLines.SetShowAtWall(ENChartWall.Bottom, True)
            scaleX.MajorGridLines.SetShowAtWall(ENChartWall.Back, True)

            Dim scaleZ As NLinearScale = New NLinearScale()
            chart.Axes(ENCartesianAxis.Depth).Scale = scaleZ
            scaleZ.MajorGridLines.SetShowAtWall(ENChartWall.Bottom, True)
            scaleZ.MajorGridLines.SetShowAtWall(ENChartWall.Left, True)

            ' add interlace stripe to the Y axis
            Dim linearScale As NLinearScale = TryCast(chart.Axes(ENCartesianAxis.PrimaryY).Scale, NLinearScale)
            Dim stripStyle As NScaleStrip = New NScaleStrip(New NColorFill(NColor.Beige), Nothing, True, 0, 0, 1, 1)
            stripStyle.Interlaced = True
            stripStyle.SetShowAtWall(ENChartWall.Back, True)
            stripStyle.SetShowAtWall(ENChartWall.Left, True)
            linearScale.Strips.Add(stripStyle)

            ' add the surface series
            m_Surface = New NMeshSurfaceSeries()
            chart.Series.Add(m_Surface)

            m_Surface.Name = "Surface"
            m_Surface.LegendView.Mode = ENSeriesLegendMode.SeriesLogic
            m_Surface.FillColorMode = ENColorMode.Zone
            m_Surface.FlatPositionValue = 0.5
            m_Surface.Data.SetGridSize(20, 20)
            m_Surface.Fill = New NColorFill(NColor.YellowGreen)

            FillData(m_Surface)

            Return chartViewWithCommandBars
        End Function

        Private Sub FillData(surface As NMeshSurfaceSeries)
            Dim m = 200
            Dim n = 100

            Dim lastM = m - 1
            Dim lastN = n - 1

            Dim centerX As Double = 0
            Dim centerZ As Double = 0
            Dim centerY As Double = 0

            Dim radius1 = 100.0
            Dim radius2 = 10.0

            Dim beginAlpha As Double = 0
            Dim endAlpha = NMath.PI2
            Dim alphaStep = 2 * NMath.PI2 / m

            Dim beginBeta As Double = 0
            Dim endBeta = NMath.PI2
            Dim betaStep = NMath.PI2 / n

            Dim arrPrecomputedData = New NVector2DD(m - 1) {}

            For i = 0 To m - 1
                ' calculate the current angle, its cos and sin
                Dim alpha = If(i = lastM, endAlpha, beginAlpha + i * alphaStep)

                arrPrecomputedData(i).X = Math.Cos(alpha)
                arrPrecomputedData(i).Y = Math.Sin(alpha)
            Next

            Dim vertexIndex = 0

            surface.Data.HasColors = True
            surface.Data.SetGridSize(m, n)

            Dim beginColor = NColor.Red
            Dim endColor = NColor.Blue

            Dim offset As Single = -100

            For j = 0 To n - 1
                ' calculate the current beta angle
                Dim beta = If(j = lastN, endBeta, beginBeta + j * betaStep)
                Dim fCosBeta As Double = CSng(Math.Cos(beta))
                Dim fSinBeta As Double = CSng(Math.Sin(beta))

                offset = -100

                For i = 0 To m - 1
                    Dim fCosAlpha = arrPrecomputedData(i).X
                    Dim fSinAlpha = arrPrecomputedData(i).Y

                    Dim fx = fCosBeta * radius2 + radius1

                    Dim dx = fx * fCosAlpha
                    Dim dz = fx * fSinAlpha
                    Dim dy = -(fSinBeta * radius2)

                    Dim x = centerX + dx
                    Dim y = centerY + dy + offset
                    Dim z = centerZ + dz

                    offset += 1

                    surface.Data.SetValue(i, j, y, x, z)

                    Dim length = Math.Sqrt(dx * dx + dz * dz + dy * dy)
                    surface.Data.SetColor(i, j, InterpolateColors(beginColor, endColor, i / 100.0F)) '(length - (radius1 - radius2)) / radius2));

                    vertexIndex += 1
                Next
            Next
        End Sub

        Public Shared Function InterpolateColors(color1 As NColor, color2 As NColor, factor As Single) As NColor
            If factor > 1.0F Then
                factor = 1.0F
            ElseIf factor < 0.0 Then
                factor = 0.0F
            End If

            Dim r1 As Integer = color1.R
            Dim g1 As Integer = color1.G
            Dim b1 As Integer = color1.B

            Dim r2 As Integer = color2.R
            Dim g2 As Integer = color2.G
            Dim b2 As Integer = color2.B

            Dim num7 As Byte = r1 + (r2 - r1) * factor
            Dim num8 As Byte = g1 + (g2 - g1) * factor
            Dim num9 As Byte = b1 + (b2 - b1) * factor

            Return NColor.FromRGB(num7, num8, num9)
        End Function

        Public Function CreateExampleControls() As NWidget
            Dim stack As NStackPanel = New NStackPanel()
            Dim group As NUniSizeBoxGroup = New NUniSizeBoxGroup(stack)

            Dim smoothShadingCheckBox As NCheckBox = New NCheckBox()
            smoothShadingCheckBox.CheckedChanged += AddressOf OnSmoothShadingCheckBoxCheckedChanged
            smoothShadingCheckBox.Checked = False
            smoothShadingCheckBox.HorizontalPlacement = Layout.ENHorizontalPlacement.Left
            stack.Add(NPairBox.Create("Smooth Shading:", smoothShadingCheckBox))

            Return group
        End Function

        Private Sub OnSmoothShadingCheckBoxCheckedChanged(arg As NValueChangeEventArgs)
            m_Surface.ShadingMode = If(arg.NewValue, ENShadingMode.Smooth, ENShadingMode.Flat)
        End Sub

        Public Function GetExampleDescription() As String
            Return "

The example demonstrates the ability of the Mesh Surface Series to assign custom color per each individual surface vertex.

" End Function ''' ''' Gets the relevant documentation links for the example ''' ''' Public Function GetDocumentationUrls() As (String, String)() Return {("Mesh Surface Series", "https://www.nevron.com/docs/openvision/mesh-surface-chart-series.html"), ("chart-palettes", "https://www.nevron.com/docs/openvision/chart-palettes.html"), ("Overview", "https://www.nevron.com/docs/openvision/chart-legeng-overview.html")} End Function #End Region #Region "Implementation" #End Region #Region "Event Handlers" #End Region #Region "Fields" Private m_Chart As NChart Private m_Surface As NMeshSurfaceSeries #End Region #Region "Static Methods" #End Region #Region "Constants" #End Region #Region "Nested Types" #End Region End Class

Download a fully functional VB.NET (.vb) Mesh Surface Custom Colors Example for WPF Solution