NOV Diagram for .NET - the best solution for building advanced Engineering, Technical, Electrical and Scientific diagrams with .NET.

Technical Diagrams with NOV Diagram for .NET

NOV Diagram for .NET provides engineers, scientists, architects, and technical professionals with a powerful platform for creating precise technical diagrams, engineering schematics, electrical diagrams, process flows, and scientific visualizations. Build, edit, and integrate complex technical drawings into .NET applications with extensive shape libraries, intelligent connectors, automatic layouts, and cross-platform support.

Typical Technical Diagrams

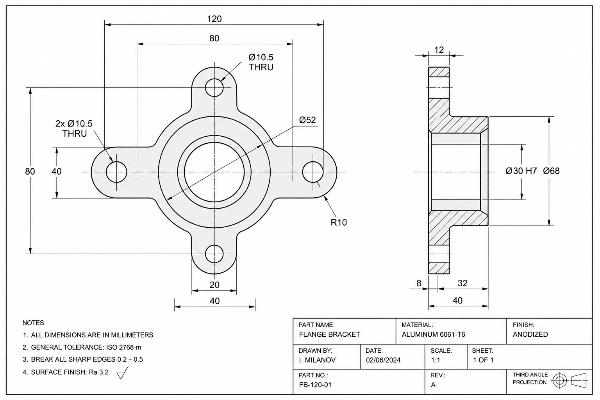
mechanical engineering diagram

Engineering Diagrams

Engineering diagrams are technical drawings that visually represent the design and construction of mechanical, civil, and industrial systems, including their components, assemblies, dimensions, connections, and technical specifications.

NOV Diagram for .NET provides the shapes and diagramming features required to create detailed technical diagrams, including:
  • Drawing scale — define a drawing scale so that diagram measurements correspond accurately to real-world dimensions, making it possible to create engineering drawings that represent physical objects and systems at a consistent and meaningful scale.
  • Dimensioning shapes — specialized dimensioning shapes for displaying precise measurements and technical callouts, including dimension lines, extension lines, arrows, and measurement labels.
  • Mechanical and engineering component shapes — extensive collections of specialized shapes for representing mechanical parts, components, equipment, structural elements, and other engineering objects, reducing the need to draw complex components from scratch.
  • Connectors and intelligent connection points — flexible connectors and precisely positioned connection points make it easy to represent relationships, physical connections, flow paths, and interfaces between engineering components.
  • Callouts and annotations — add detailed annotations, labels, technical notes, callouts, and other descriptive information to identify components and communicate engineering specifications directly within the diagram.
  • Alignment, snapping, and layout tools — precise alignment, snapping, distribution, grouping, and layout capabilities help position components accurately and maintain clean, consistent, and professional technical drawings.
  • Layers and grouping — organize complex engineering diagrams into logical layers and groups, making it easier to manage assemblies, separate different systems or components, and control the visibility and organization of diagram elements.

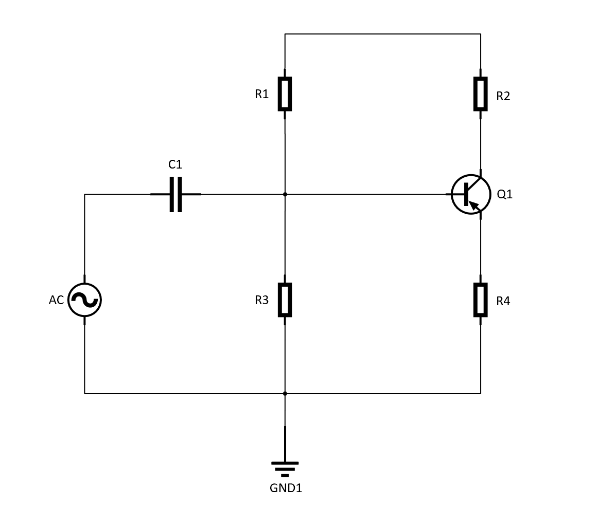
electrical circuit diagram

Electrical and Circuit Diagrams

Electrical and circuit diagrams are visual representations of electrical systems, showing components, connections, wiring, signal paths, and the flow of electrical power or information using standardized symbols and conventions.

NOV Diagram for .NET provides the features and specialized shapes needed to easily create professional electrical and circuit diagrams, including:
  • Comprehensive electrical symbol shapes — extensive libraries covering analog and digital logic, fundamental electrical components, integrated circuits, switches and relays, transformers and windings, terminals and connectors, transmission paths, radio/electrical equipment, maintenance symbols, and other standardized electrical symbols.
  • Routable connectors with bridges (hops) — connectors automatically route around diagram elements and display bridges at intersections, making complex electrical connections easy to follow and eliminating ambiguity where wires cross.
  • Directional ports — ports can have inward or outward direction, helping enforce the intended flow of connections and preventing invalid connection directions.
  • Automatic graph layouts — intelligent graph-layout algorithms automatically arrange circuit elements while minimizing connector crossings, unnecessary bends, and visual clutter.
  • Custom shape data — associate user-defined properties with diagram elements, such as manufacturer, model, capacity, voltage, part number, or other engineering-specific information.

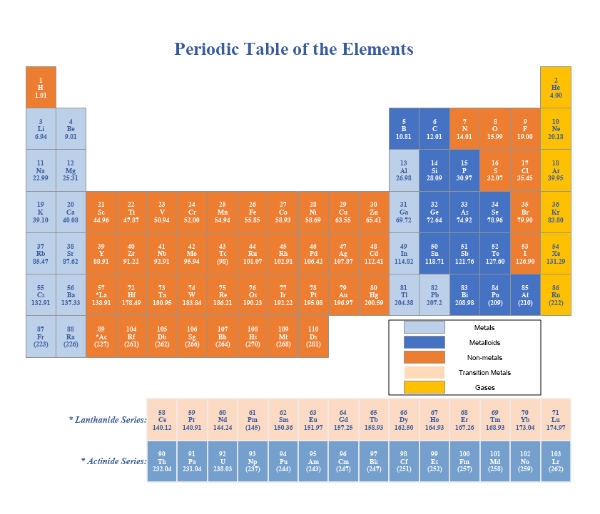
periodic table of elements

Scientific Diagrams

Scientific diagrams are visual representations of scientific systems, experiments, processes, structures, and relationships between physical components or concepts.

NOV Diagram provides the features and specialized shapes needed to easily create detailed scientific diagrams, including:
  • Scientific and biology clipart shapes — extensive collections of ready-to-use shapes covering a wide range of scientific and biological topics, making it easy to illustrate experiments, organisms, laboratory equipment, anatomical structures, and scientific concepts.
  • Rich text and scientific notation — industry-leading rich text capabilities with support for subscript, superscript, special symbols, and advanced text formatting, making NOV Diagram well suited for formulas, equations, chemical notation, and other complex scientific annotations.
  • Table shapes with merged cells — flexible table shapes with support for merged cells, providing an indispensable way to create structured notes, legends, classifications, experimental data, and other tabular information within scientific diagrams.
  • Force-directed graph layouts — powerful graph-layout algorithms designed for arranging very large and complex diagrams, particularly useful for visualizing networks, relationships, structures, and other interconnected scientific data.


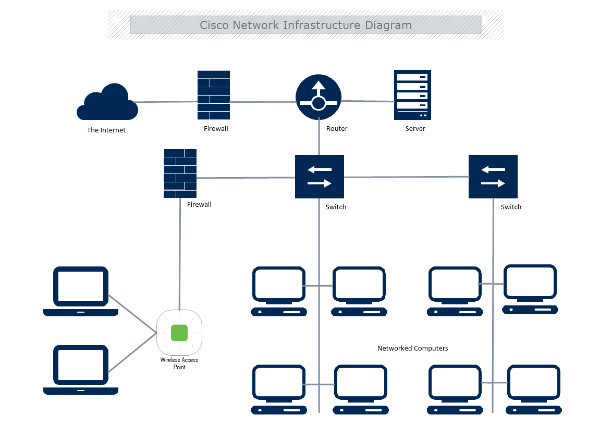
cisco network diagram

Network Diagrams

Visualize network topologies, infrastructure layouts, devices, connections, and communication systems with clear and precise network diagrams.

NOV Diagram provides the features and specialized shapes needed to easily create detailed network diagrams, including:
  • Specialized networking shapes — comprehensive networking symbols for general network components such as computers, routers, switches, servers, and firewalls, as well as industry-standard icon sets for platforms such as Amazon Web Services (AWS), Google Cloud, and Microsoft Azure.
  • Table shapes with merged cells — tables can be placed inside network component shapes, such as firewalls, computers, and servers, to display network-specific information including IP addresses, bandwidth, ports, configuration parameters, and other technical properties.
  • Layered graph layouts — industry-leading support for layered graph layouts, which are particularly well suited to network diagrams where components commonly follow a source-to-sink topology, such as routers, switches, and connected computers.
  • Routable connectors with hops — intelligent connectors automatically route around network components and display bridges (hops) at intersections, making connections in complex networks easier to follow and eliminating ambiguity when multiple connections cross.


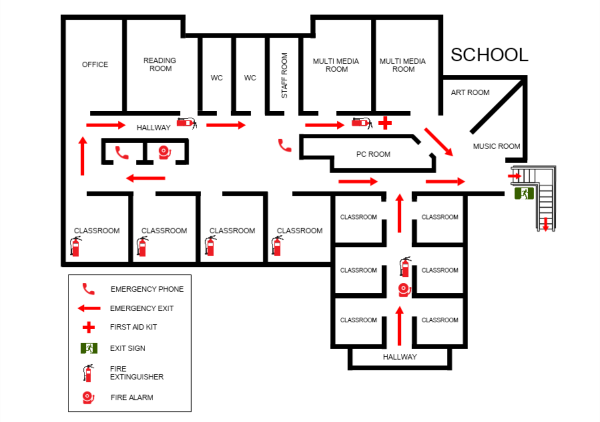
evacuation plan

Floorplan Diagrams

Create precise floorplans and space layouts for buildings, offices, facilities, and other physical environments.

NOV Diagram provides the features and specialized shapes needed to easily create detailed floorplan diagrams, including:

  • Specialized floorplan shapes — extensive collections of ready-to-use shapes for essential floorplan elements, including appliances, building core elements, comfort and HVAC equipment, furniture and décor, electronics, plumbing fixtures, storage, surfaces, and pre-built room and furnishing units.
  • Drawing scale — define a drawing scale so that diagram dimensions correspond accurately to real-world measurements, making floorplans suitable for creating precise representations of physical spaces.
  • Dimensioning shapes — specialized dimensioning shapes for displaying accurate distances and measurements, including dimension lines, extension lines, arrows, and measurement labels.
  • Directional ports with automatic orientation — shapes support inward and outward ports that can be glued to matching ports on other shapes. This is particularly useful for floorplan elements such as furniture: for example, a chair can be glued to the side of a table, with port-to-port connections automatically matching their directions and orienting the chair toward the table.
  • Scalable vector shapes — precise, scalable shapes that can be resized and positioned to accurately represent rooms, furniture, equipment, fixtures, and other physical elements.
  • Rich text and annotations — add room names, dimensions, labels, notes, legends, and other descriptive information directly to floorplans.
  • Precise alignment and positioning — snapping, alignment, grouping, and other diagramming tools make it easy to arrange floorplan elements accurately and maintain consistent layouts.

Why Use NOV Diagram for .NET for Technical Diagrams

NOV Diagram for .NET combines powerful technical drawing tools, specialized shape libraries, intelligent connectivity, precision measurement, and advanced diagramming capabilities to support a wide range of engineering, electrical, scientific, network, and floorplan applications.

  • Technical Shape Libraries — use extensive collections of specialized engineering, mechanical, electrical, scientific, networking, and floorplan shapes and symbols to quickly build professional technical diagrams.
  • Precision Drawing and Scaling — create accurate technical drawings using drawing scales, precise drawing tools, snapping, alignment, and positioning features that help maintain real-world proportions and geometric accuracy.
  • Dimensioning and Callouts — add linear, radial, angular, and other dimension shapes, together with technical callouts, labels, annotations, and notes, to clearly communicate measurements and specifications.
  • Intelligent Connectors and Ports — connect components using intelligent connection points and directional ports, with automatic routing, obstacle avoidance, and connector bridges that keep complex diagrams clear and unambiguous.
  • Advanced Geometry and Constructive Drawing — create precise technical geometry using lines, circles, arcs, angles, and other geometric construction methods, including circle-by-point-and-radius and other construction techniques.
  • Smart Shape Behavior — create shapes with specialized connection points, directional behavior, custom properties, and other application-specific functionality, enabling diagrams to represent real-world technical objects and their relationships.
  • Rich Text, Tables, and Annotations — combine technical graphics with formatted text, scientific notation, tables with merged cells, legends, labels, and structured technical information directly within diagrams.
  • Automatic Diagram Layouts — automatically organize complex diagrams using graph, layered, and force-directed layouts, reducing connector crossings and visual clutter while preserving the relationships between components.
  • Layers and Grouping — organize large and complex technical drawings into logical layers and groups, making it easier to manage assemblies, systems, components, and different levels of technical information.
  • Interactive Diagram Editing — provide users with an intuitive environment for creating and editing technical drawings through zooming, panning, snapping, alignment, selection, resizing, and direct manipulation of diagram elements.
  • Custom Shapes and Data — define application-specific shapes and associate custom data with diagram elements, allowing technical diagrams to incorporate specialized symbols, component properties, specifications, and domain-specific information.
  • Cross-Platform .NET — build technical diagramming applications for Blazor, WinForms, WPF, and macOS, using the same powerful diagramming technology across platforms.