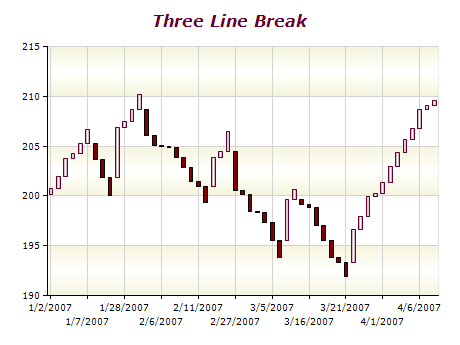
Nevron Logo

WinForms Three Line Break Chart

Tree Line Break Chart

Tree Line Break charts are technical charts traders use to analyze price movements. These charts display vertical boxes or "lines" based on price changes. The lines are created based on whether the closing price is higher or lower than the previous one. If there is a powerful rally or sell-off, several consecutive lines with the same direction are formed. To create a new line, prices must reverse by the extreme price of the last several lines. Typically, three consecutive lines are used for the reversal criterion, giving the chart its name.
Like other types of technical charts, such as Kagi, Point and Figure, and Renko charts, Three Line Break charts ignore the passage of time and focus solely on price movements. This makes them particularly useful for identifying trends and potential trading opportunities. Traders can use Three Line Break charts to spot reversals, confirm trends, and set entry and exit points for trades.
To use Three Line Break charts effectively, it's important to understand the basic principles of this charting technique, including how to interpret price movements, identify key support and resistance levels, and spot chart patterns. Traders should also use Three Line Break charts with other technical analysis tools, such as moving averages, to confirm trading signals and improve their overall analysis.

Sample Table Format

DateClose Price Trend Direction
2022-01-01 100N/A
2022-01-02 105Up
2022-01-03 102Down
2022-01-04 98Down
2022-01-05 96Down
2022-01-06 103Up

In a Three-Line Break chart, each row represents a specific date, closing price, and trend direction. The trend direction column indicates whether the current price trend is up or down. A new rising line is drawn if the closing price is higher than the previous one, and a new falling line is drawn if the closing price is lower than the previous one. If a rally or a sell-off is powerful enough to form several consecutive lines with the same direction, then prices must reverse by the extreme price of the last several lines in order to create a new line.

Best practices for using a tree-line chart

  • Understand the concept: A three-line break chart is based on a series of price movements rather than time. It works by only drawing a new line when the price moves by a certain amount (usually three times the box size) in a certain direction. This helps filter out noise and provide a clearer picture of the trend.
  • Choose the box size carefully: The box size is the amount of price movement required to draw a new line. Choosing the right box size is important as it can affect the clarity of the chart. A larger box size will result in fewer lines and a clearer picture of the overall trend, while a smaller box size will result in more lines and more short-term fluctuations.
  • Combine with other indicators: Three-line break charts can be used in conjunction with other indicators such as moving averages or support and resistance levels to confirm trends or identify potential entry and exit points.
  • Use for medium to long-term analysis: Three-line break charts are best suited for medium to long-term analysis as they can help filter out short-term noise and provide a clearer picture of the overall trend.