NOV Chart for WPF is the World’s most powerful, and feature-rich charting control for WPF. With its extensive range of features and extreme performance this advanced charting control empowers developers to effortlessly integrate realtime and visually appealing charts into their WPF applications with ease.
Complete set of charting types
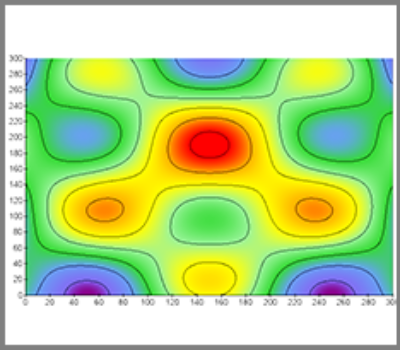
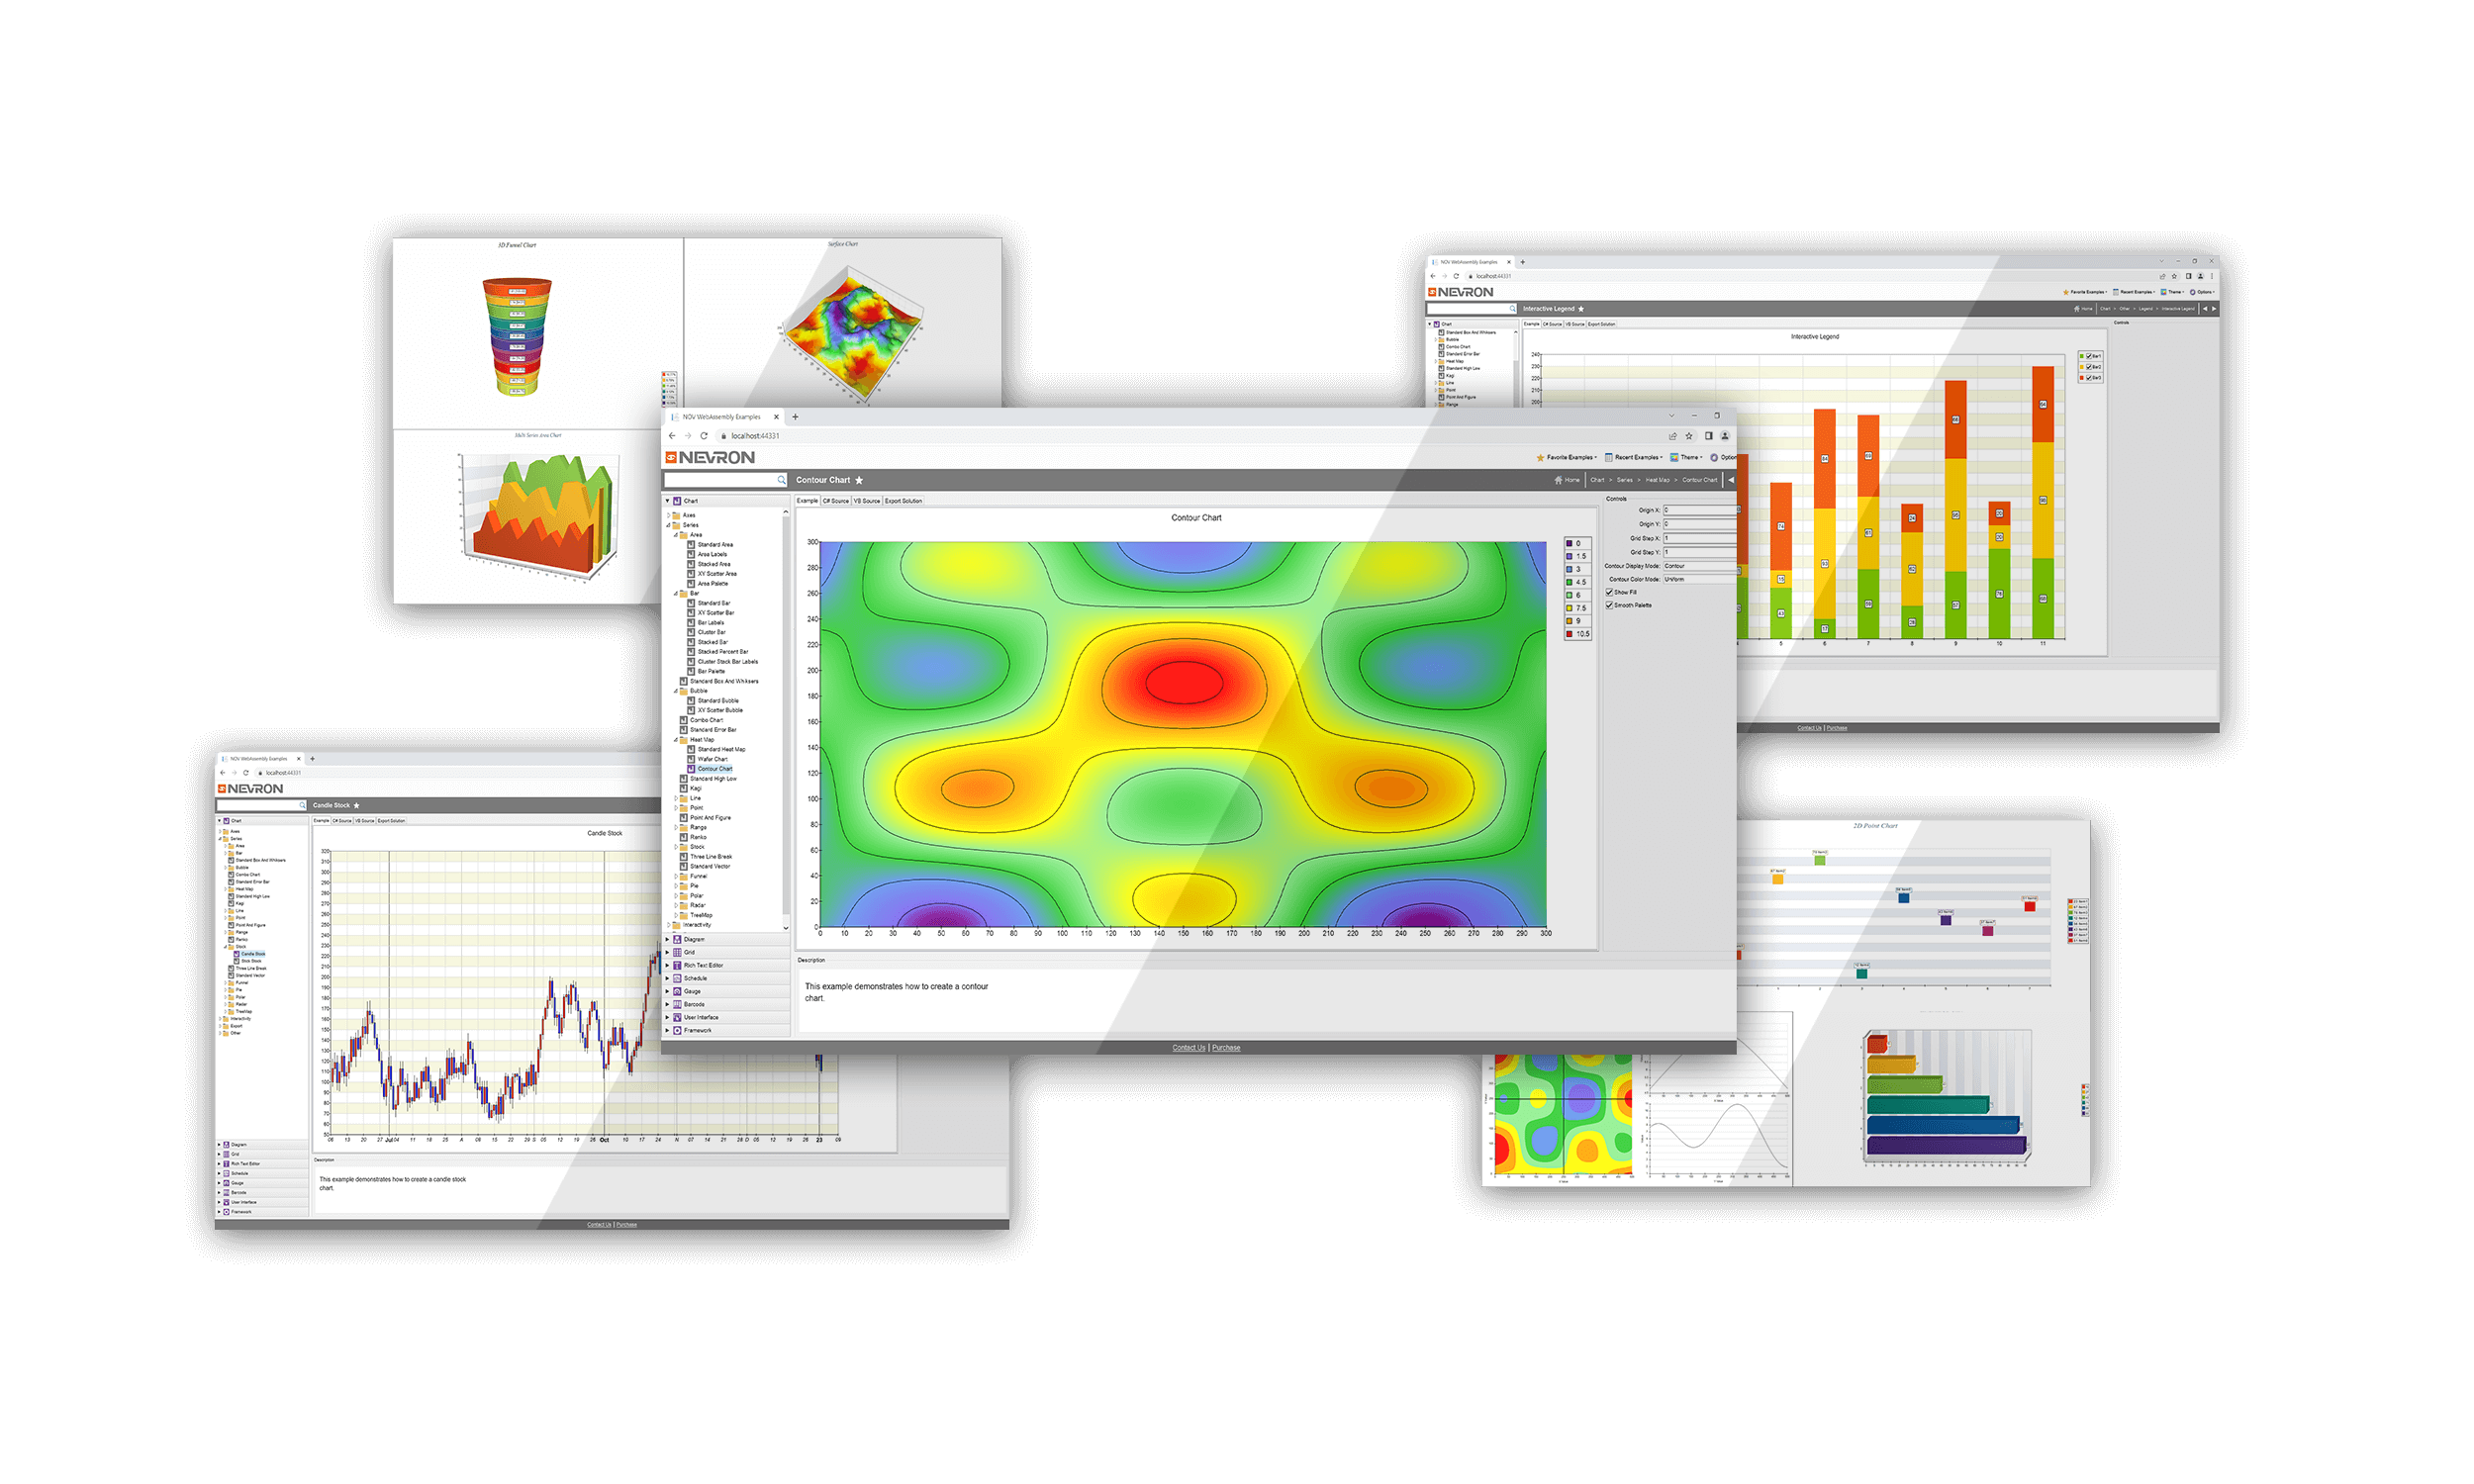
The NOV WPF Chart control provides all common 2D and 3D charting types, catering to a diverse range of data visualization needs. Developers can choose from various chart types, such as point, line, bar, bubble, pie, different scatters and surface charts, heat maps, stacks, and clusters as well as non-cartesian charts like polar, radar, treemap, funnel, and many more for a total of 100+ charting types variations.
Advanced chart axis model
The chart control boasts an advanced axis model, empowering you to fine-tune and configure chart axes according to your requirements. This includes complete control over the axes’ position like docking, crossing, automatic positioning in 3D, and others. Every aspect of the visual appearance of axis elements such as axis labels, formatting, ticks, ruler, scale breaks, sections, and other essential attributes is controllable to
ensure your charts provide accurate and readable information to the viewer. The control also features lots of specialized axis scale types such as date-time, time-span, table, numeric and logarithmic, hierarchical, range,
and timeline axis scale types. Shortly, all types of scales found in modern data visualization applications are supported by the control. With the NOV Chart for WPF, charts can be both visually stunning and informative.
Best in class Interactivity features
The control supports many interactivity features like data zooming, scrolling, panning, offset, trackball (interactive 3D rotation), cursors, hit-testing, and tooltips. Enabling users to explore specific chart areas in detail by zooming in or out allows
them to navigate through large data sets effortlessly. In addition, you can use custom tooltips and cursors to provide contextual information when the user hovers over data points, thus delivering a richer and more interactive experience.
Hit testing allows you to implement code that reacts to the user's actions dynamically based on the selected chart element.
Optimized for high-performance charting
Experience unparalleled performance with the NOV WPF Chart's proprietary OpenGL based, GPU and CPU-optimized 2D and 3D rendering engine. The Nevron 2D/3D rendering engine is tightly integrated with the control to provide best-in-class performance using advanced graphics programming techniques like shaders, memory-mapped vertex buffers, multithreading, vectorized code, and others.
The control associates an OpenGL framebuffer with a Direct2D image to ensure all rendering is executed on the GPU directly in the WPF panel. Whether working with small or very large data sets, this charting control ensures fast and responsive real-time chart rendering. Your charts will load quickly and operate smoothly, even with complex and data-intensive
visualizations, with millions of data points. All this is achieved while at the same time retaining visual quality using MSAA antialiasing and subpixel glyph antialiasing not found in any other charting package.
Integration with other NOV components.
NOV Chart for WPF seamlessly integrates with other NOV controls thus allowing you to enrich your text or diagram documents and reports with dynamic charts. Further, you can embed other NOV controls like Diagrams, Maps, and Gauges in the chart surface to display complex dashboards, a unique feature not found in any other charting control for WPF.
In addition, integration with other controls is not just visual - they share a common DOM that you can serialize/deserialize, edit with a designer or query from code. The content of a chart surface containing charts, diagrams, gauges and other widgets can be exported to different medias like PDF, SVG, EMF and raster images.
Integrated printing with other NOV controls is also available.
NOV WPF Chart is the best charting control for WPF applications. Its extensive features, customization options, high performance, and seamless integration with other NOV control make it an ideal choice for developers seeking to embed advanced charting functionality in their WPF applications.