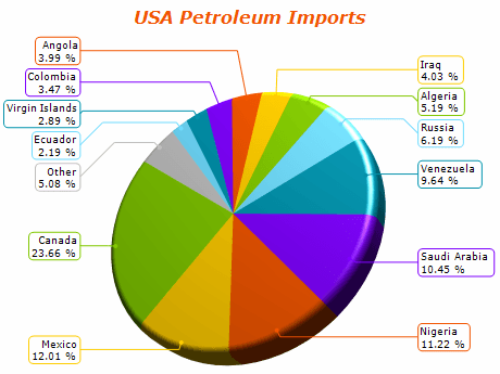
NOV Chart for Blazor WebAssembly is a powerful charting component for creating interactive
data visualizations in modern web applications. It provides a complete set of chart types,
advanced axes and scales, flexible customization options, and built-in interaction features
such as zooming, scrolling, tooltips, and hit testing.
Complete set of charting types
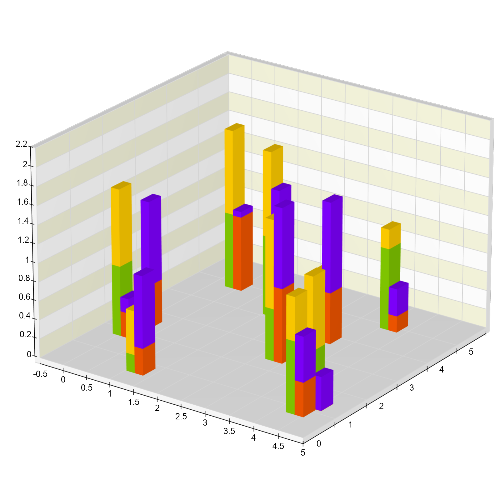
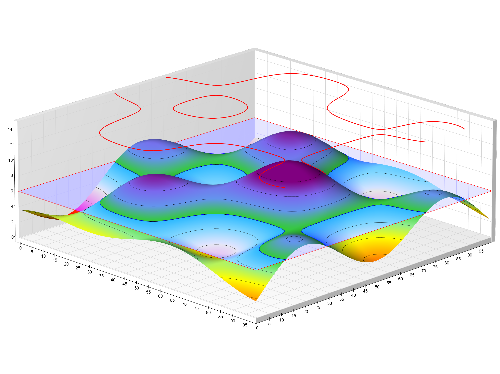
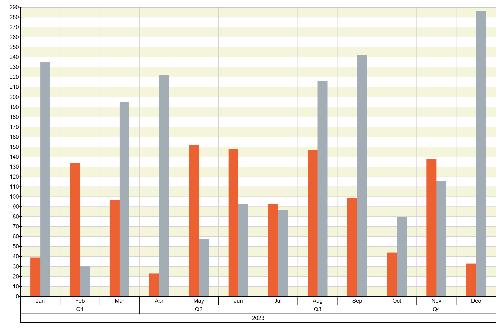
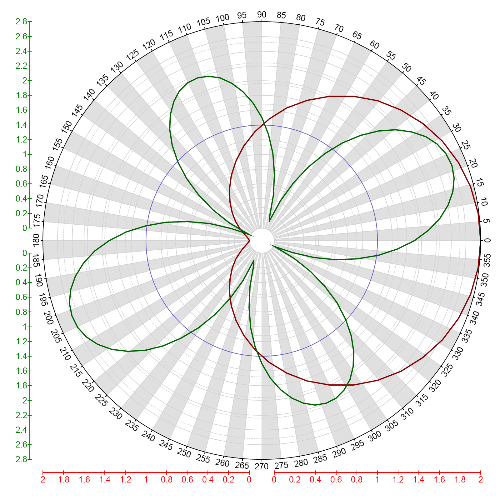
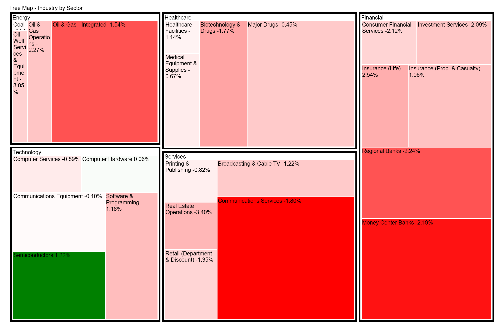
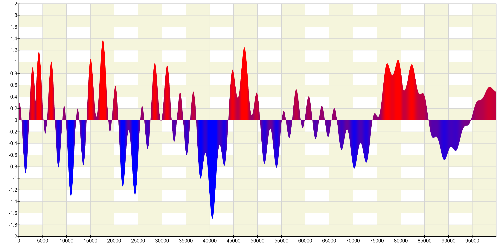
NOV Chart for Blazor WebAssembly includes a wide range of chart types for different data
visualization scenarios. Developers can create bar, line, pie, scatter, area, polar, radar,
stacked, and 3D charts to effectively represent complex data.
Unlimited chart series and axes
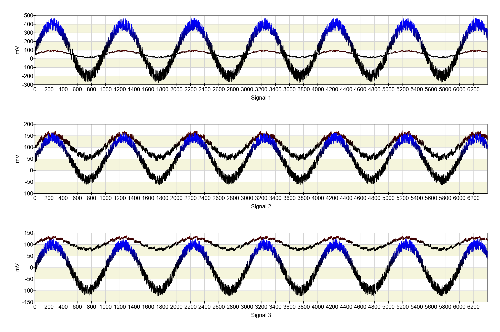
NOV Chart allows developers to add multiple chart series and axes to a single visualization.
This makes it possible to display and compare multiple data sets and create complex chart
layouts.
Advanced chart axis model
The advanced axis model provides precise control over chart scales and axis appearance.
Developers can customize axis elements such as labels, tick marks, grid lines, ranges,
titles, and formatting to meet specific application requirements.
Interactive features - zooming, scrolling, tooltips, hit testing
NOV Chart includes rich interaction features that allow users to explore chart data more
effectively. Zooming and scrolling provide easy navigation of large data sets, while
tooltips and hit testing provide additional information about individual chart elements.
Optimized for high-performance charting
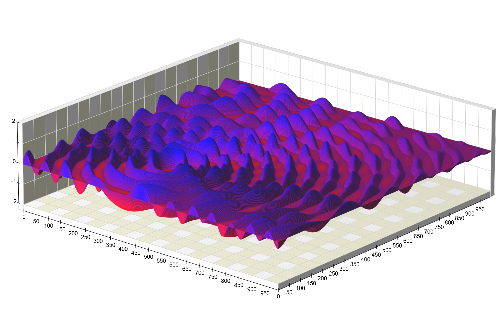
NOV Chart for Blazor WebAssembly is designed for fast rendering and responsive user
interfaces. Optimized rendering techniques and efficient data processing allow applications
to display large data sets while maintaining smooth performance.
NOV Chart for Blazor WebAssembly provides developers with a complete solution for creating
interactive and high-performance charts in web applications. With its extensive chart types,
advanced axis model, flexible customization, and rich interaction features, it is suitable
for both simple visualizations and complex data analysis scenarios.

 Open Vision for .NET
 NOV Chart for .NET
 NOV Diagram for .NET
 NOV Rich Text Editor for .NET
 NOV Grid for .NET
 NOV Schedule for .NET
 NOV Gauge for .NET
 NOV Barcode for .NET
 NOV User Interface for .NET
 Vision for .NET
 Chart for .NET
 Diagram for .NET
 User Interface for .NET
 Vision for SSRS
 Chart for SSRS
 Gauge for SSRS
 Map for SSRS
 Barcode for SSRS
 Vision for SharePoint
 Chart for SharePoint
 Gauge for SharePoint
 Map for SharePoint
 Barcode for SharePoint