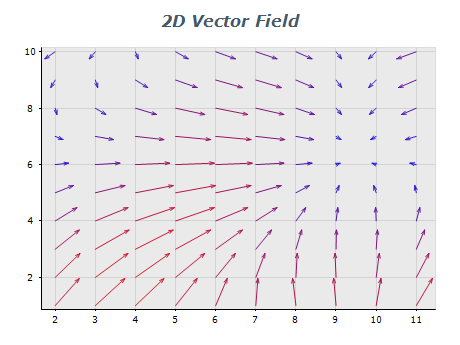
Nevron Logo

Vector Chart

Vector charts use arrows or lines to represent data points. Vector charts help display complex data sets with magnitude and direction, such as wind or water currents. Vector charts are handy for scientific and engineering applications, as well as in geography and meteorology. They allow users to easily visualize complex data sets and identify patterns and trends in the data.

Sample Table Format

Begin XBegin YEnd XEnd Y
0 0 5 5
2 1 7 4
4 3 9 8
6 4 11 6
8 6 13 11

In this sample table, each row represents a data point with four coordinates: the Begin X and Begin Y coordinates define the starting point of the arrow, while the End X and End Y coordinate define the ending point of the arrow. The length and direction of each arrow will be determined by the values in the End X and End Y columns.

Best practices for using vector charts

  • Choose the right type of vector chart: Many types of vector charts are available, each with strengths and weaknesses. Consider the type of data you are trying to visualize and choose the chart type that will best represent that data.
  • Ensure data accuracy: Vector charts rely on accurate data points to create accurate representations of your data. Ensure your data is properly collected, processed, and inputted into the charting software.
  • Use appropriate scale and units: The scale of your chart should be relevant to the data you are visualizing. It's also important to ensure that the units used to define the magnitude and direction of the data points are consistent and appropriate.
  • Customize the appearance of the chart: Vector charts can be customized to fit the specific needs of your data. Choose arrow styles and colors that work well with your data, and adjust the size and position of the chart as needed.
  • Use labels and annotations: Labels and annotations can be added to a vector chart to provide additional context and make the chart easier to interpret. Consider adding labels to indicate the direction and magnitude of the arrows or annotations to highlight specific data points.
  • Keep it simple: Vector charts can quickly become complex and difficult to interpret. Keep your chart as simple as possible by limiting the number of data points and choosing a straightforward, easy-to-read design.