ProductsAll Products
.NET Components
DownloadsAll Downloads
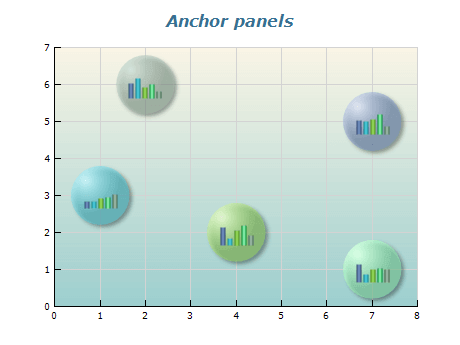
The chart can position different panels to key chart elements such as data points, axis values, 2D and 3D model coordinates, and others. This makes it easy to create dynamic annotations that provide additional information about those chart elements.
| ||||||||||||||||||||||||||||
|