Nevron NOV Chart for WinForms ships with hundreds of examples with full source code, as part of the Nevron Open Vision Suite.
All WinForms Chart examples are also available as a stand-alone Visual Studio solution
in C# and VB.NET,
which you can download from the links below.
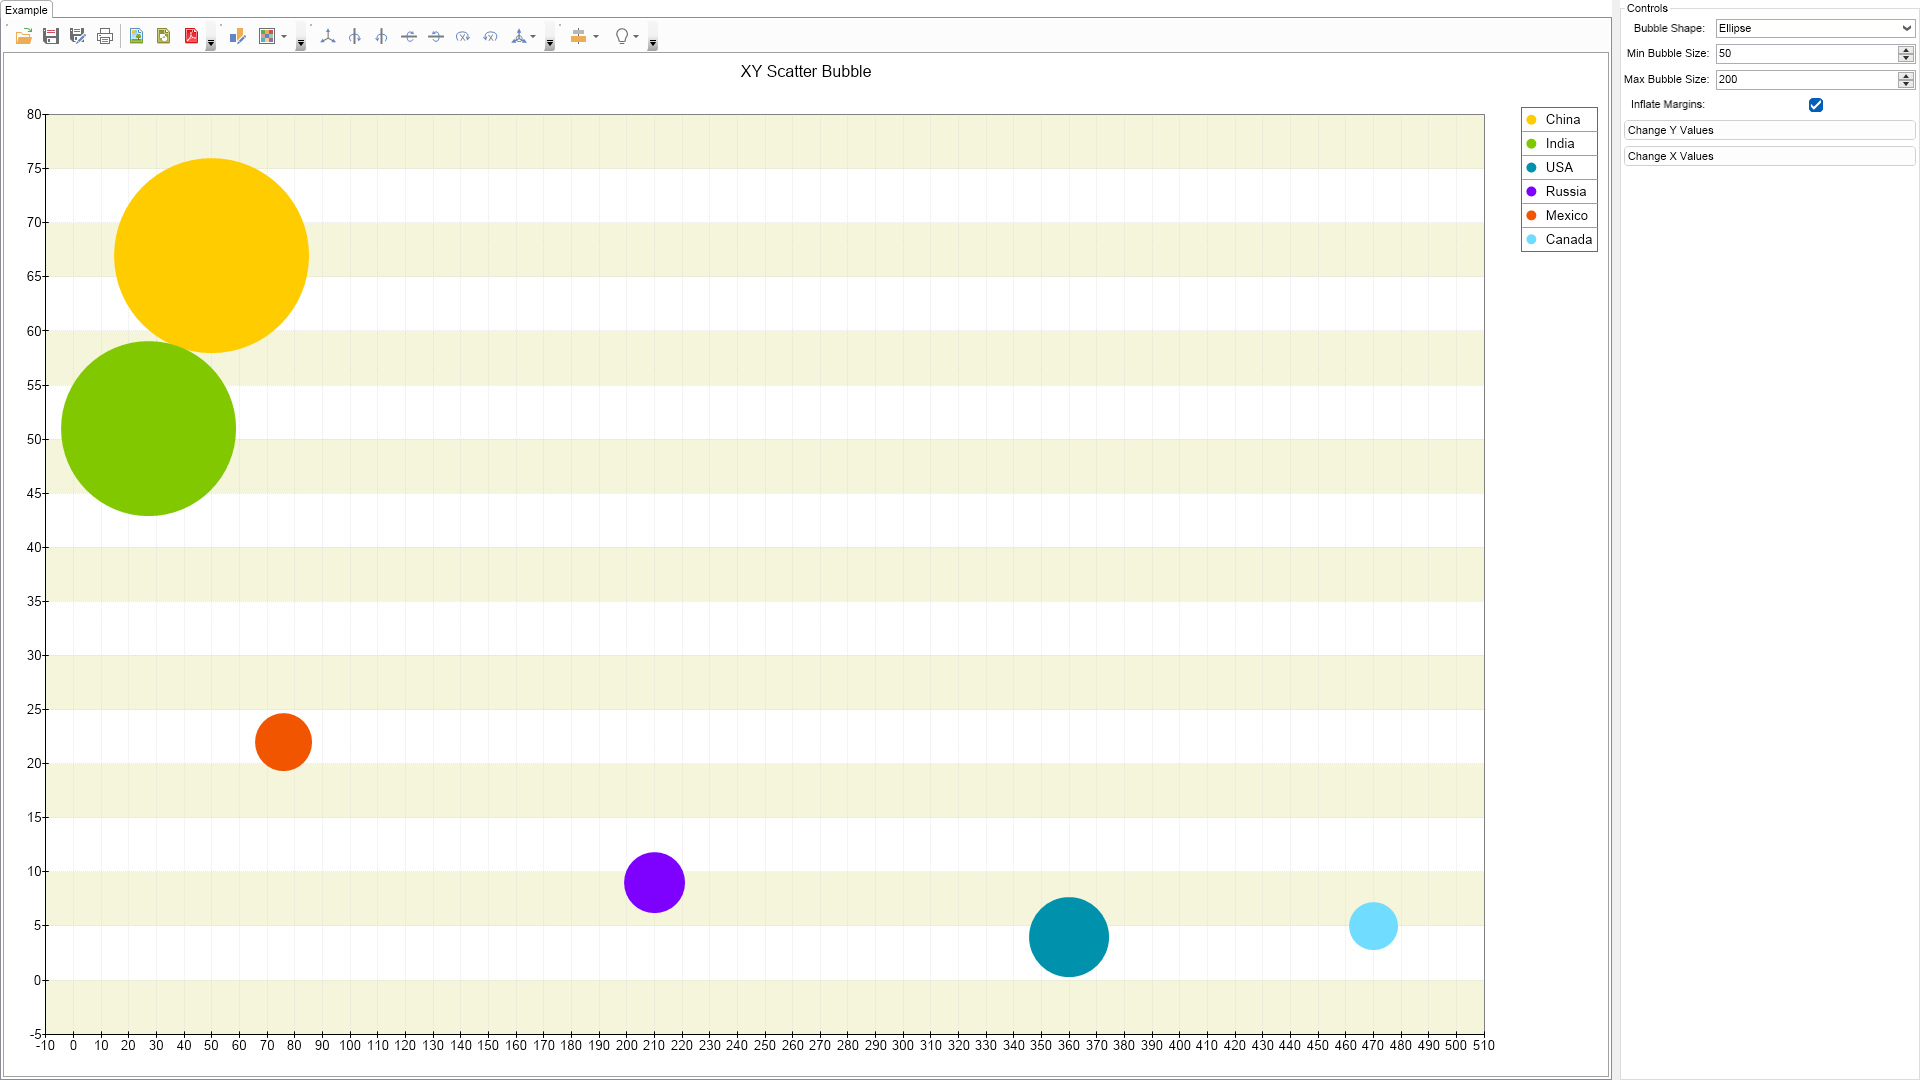
XY Scatter Bubble Example for WinForms Description
This example demonstrates how to create a XY scatter bubble chart.
C# XY Scatter Bubble Example Code for Nevron Chart for WinForms
Language: C#
using Nevron.Nov;
using Nevron.Nov.Chart;
using Nevron.Nov.Dom;
using Nevron.Nov.Graphics;
using Nevron.Nov.Layout;
using Nevron.Nov.UI;
using Nevron.Nov.Windows.Forms;
using System;
using System.Windows.Forms;
namespace NovWinFormsProject
{
public partial class Form1 : Form
{
#region Constructors
public Form1()
{
InitializeComponent();
// Set form title
Text = "NOV WinForms - NXYScatterBubbleExample";
// Create the NOV example and its controls
NWidget exampleContent = CreateExampleContent();
NWidget exampleControls = CreateExampleControls();
if (exampleControls != null)
{
exampleControls.PreferredWidth = 300;
}
// Place the example and its controls in a pair box
NPairBox pairBox = new NPairBox(exampleContent, exampleControls);
pairBox.FillMode = ENStackFillMode.First;
pairBox.FitMode = ENStackFitMode.First;
pairBox.Margins = new NMargins(NDesign.HorizontalSpacing, NDesign.VerticalSpacing);
// Host the example in the form
NNovWidgetHost host = new NNovWidgetHost(pairBox);
host.Dock = DockStyle.Fill;
Controls.Add(host);
}
#endregion
#region Example
public NWidget CreateExampleContent()
{
NChartViewWithCommandBars chartViewWithCommandBars = new NChartViewWithCommandBars();
NChartView chartView = chartViewWithCommandBars.View;
chartView.Surface.CreatePredefinedChart(ENPredefinedChartType.Cartesian);
// configure title
chartView.Surface.Titles[0].Text = "XY Scatter Bubble";
// configure chart
m_Chart = (NCartesianChart)chartView.Surface.Charts[0];
m_Chart.SetPredefinedCartesianAxes(ENPredefinedCartesianAxis.XYLinear);
// configure the chart
NLinearScale yScale = (NLinearScale)m_Chart.Axes[ENCartesianAxis.PrimaryY].Scale;
yScale.MajorGridLines = new NScaleGridLines();
yScale.MajorGridLines.Stroke.DashStyle = ENDashStyle.Dot;
// add interlace stripe
NScaleStrip strip = new NScaleStrip(new NColorFill(NColor.Beige), null, true, 0, 0, 1, 1);
strip.Interlaced = true;
yScale.Strips.Add(strip);
NLinearScale xScale = (NLinearScale)m_Chart.Axes[ENCartesianAxis.PrimaryX].Scale;
xScale.MajorGridLines = new NScaleGridLines();
xScale.MajorGridLines.Stroke.DashStyle = ENDashStyle.Dot;
// add a bubble series
m_Bubble = new NBubbleSeries();
m_Bubble = new NBubbleSeries();
m_Bubble.DataLabelStyle = new NDataLabelStyle(false);
m_Bubble.LegendView.Format = "
Download a fully functional C# (.cs) XY Scatter Bubble Example for WinForms Solution
VB.NET XY Scatter Bubble Example Code for Nevron Chart for WinForms
Language: VB.NET
Imports Nevron.Nov
Imports Nevron.Nov.Chart
Imports Nevron.Nov.Dom
Imports Nevron.Nov.Graphics
Imports Nevron.Nov.Layout
Imports Nevron.Nov.UI
Imports Nevron.Nov.Windows.Forms
Imports System
Public Class Form1
#Region "Constructors"
Public Sub New()
' This call is required by the designer.
InitializeComponent()
' Add any initialization after the InitializeComponent() call.
' Set form title
Text = "NOV WinForms - NXYScatterBubbleExample"
' Create the NOV example and its controls
Dim exampleContent As NWidget = CreateExampleContent()
Dim exampleControls As NWidget = CreateExampleControls()
If Not exampleControls Is Nothing Then
exampleControls.PreferredWidth = 300
End If
' Place the example and its controls in a pair box
Dim pairBox As NPairBox = New NPairBox(exampleContent, exampleControls)
pairBox.FillMode = ENStackFillMode.First
pairBox.FitMode = ENStackFitMode.First
pairBox.Margins = New NMargins(NDesign.HorizontalSpacing, NDesign.VerticalSpacing)
' Host the example in the form
Dim host As NNovWidgetHost(Of NWidget) = New NNovWidgetHost(Of NWidget)(pairBox)
host.Dock = DockStyle.Fill
Controls.Add(host)
End Sub
#End Region
#Region "Example"
Public Function CreateExampleContent() As NWidget
Dim chartViewWithCommandBars As NChartViewWithCommandBars = New NChartViewWithCommandBars()
Dim chartView = chartViewWithCommandBars.View
chartView.Surface.CreatePredefinedChart(ENPredefinedChartType.Cartesian)
' configure title
chartView.Surface.Titles(0).Text = "XY Scatter Bubble"
' configure chart
m_Chart = CType(chartView.Surface.Charts(0), NCartesianChart)
m_Chart.SetPredefinedCartesianAxes(ENPredefinedCartesianAxis.XYLinear)
' configure the chart
Dim yScale As NLinearScale = m_Chart.Axes(ENCartesianAxis.PrimaryY).Scale
yScale.MajorGridLines = New NScaleGridLines()
yScale.MajorGridLines.Stroke.DashStyle = ENDashStyle.Dot
' add interlace stripe
Dim strip As NScaleStrip = New NScaleStrip(New NColorFill(NColor.Beige), Nothing, True, 0, 0, 1, 1)
strip.Interlaced = True
yScale.Strips.Add(strip)
Dim xScale As NLinearScale = m_Chart.Axes(ENCartesianAxis.PrimaryX).Scale
xScale.MajorGridLines = New NScaleGridLines()
xScale.MajorGridLines.Stroke.DashStyle = ENDashStyle.Dot
' add a bubble series
m_Bubble = New NBubbleSeries()
m_Bubble = New NBubbleSeries()
m_Bubble.DataLabelStyle = New NDataLabelStyle(False)
m_Bubble.LegendView.Format = "
Download a fully functional VB.NET (.vb) XY Scatter Bubble Example for WinForms Solution

 Chart for .NET
 Diagram for .NET
 User Interface for .NET
 Vision for SSRS
 Chart for SSRS
 Gauge for SSRS
 Map for SSRS
 Barcode for SSRS
 Vision for SharePoint
 Chart for SharePoint
 Gauge for SharePoint
 Map for SharePoint
 Barcode for SharePoint
 Open Vision for .NET


 Vision for .NET