Imports Nevron.Nov
Imports Nevron.Nov.Chart
Imports Nevron.Nov.DataStructures
Imports Nevron.Nov.Dom
Imports Nevron.Nov.Graphics
Imports Nevron.Nov.Layout
Imports Nevron.Nov.UI
Imports Nevron.Nov.Windows.Forms
Imports System

Public Class Form1

#Region "Constructors"

    Public Sub New()
        ' This call is required by the designer.
        InitializeComponent()

        ' Add any initialization after the InitializeComponent() call.

        ' Set form title
        Text = "NOV WinForms - NFastLine2D"

        ' Create the NOV example and its controls
        Dim exampleContent As NWidget = CreateExampleContent()
        Dim exampleControls As NWidget = CreateExampleControls()
        If Not exampleControls Is Nothing Then
            exampleControls.PreferredWidth = 300
        End If

        ' Place the example and its controls in a pair box
        Dim pairBox As NPairBox = New NPairBox(exampleContent, exampleControls)
        pairBox.FillMode = ENStackFillMode.First
        pairBox.FitMode = ENStackFitMode.First
        pairBox.Margins = New NMargins(NDesign.HorizontalSpacing, NDesign.VerticalSpacing)

        ' Host the example in the form
        Dim host As NNovWidgetHost(Of NWidget) = New NNovWidgetHost(Of NWidget)(pairBox)
        host.Dock = DockStyle.Fill
        Controls.Add(host)
    End Sub


#End Region

#Region "Example"

        '''
        '''
        '''
        '''
        Public Function CreateExampleContent() As NWidget
            Dim chartViewWithCommandBars As NChartViewWithCommandBars = New NChartViewWithCommandBars()
            Dim chartView = chartViewWithCommandBars.View

            chartView.Registered += AddressOf OnChartViewRegistered
            chartView.Unregistered += AddressOf OnChartViewUnregistered

            Dim dockPanel As NDockPanel = New NDockPanel()
            chartView.Surface.Content = dockPanel

            m_Title = New NLabel()
            m_Title.Text = "Fast Line 2D"
            m_Title.Margins = New NMargins(NChartViewSurface.DefaultPanelMargin)
            m_Title.Font = New NFont(NFontDescriptor.DefaultSansFamilyName, NChartViewSurface.DefaultLabelFontSize)
            m_Title.TextFill = New NColorFill(NColor.Black)
            m_Title.TextAlignment = ENContentAlignment.MiddleCenter
            NDockLayout.SetDockArea(m_Title, ENDockArea.Top)
            dockPanel.AddChild(m_Title)

            m_ChannelInfos = New NList(Of NChannelInfo)()

            ' setup the fast line series
            Dim charts As NChart() = New NChart() {CreateChart(New NChannelInfo() {New NChannelInfo(NColor.Red, True, 50, 200, 14), New NChannelInfo(NColor.Blue, False, 100, 400, 10)}, 1), CreateChart(New NChannelInfo() {New NChannelInfo(NColor.Red, True, 100, 300, 13), New NChannelInfo(NColor.Blue, False, 50, 140, 15)}, 2), CreateChart(New NChannelInfo() {New NChannelInfo(NColor.Red, True, 100, 200, 17), New NChannelInfo(NColor.Blue, False, 0, 100, 8)}, 3)}

            Dim chartPercentage As Single = 100 / charts.Length
            Dim chartBegin As Single = 0

            Dim chartsPanel As NStackPanel = New NStackPanel()
            chartsPanel.Direction = ENHVDirection.TopToBottom
            chartsPanel.FillMode = ENStackFillMode.Equal
            chartsPanel.FitMode = ENStackFitMode.Equal

            NDockLayout.SetDockArea(chartsPanel, ENDockArea.Center)
            chartsPanel.Margins = New NMargins(NChartViewSurface.DefaultPanelMargin)
            dockPanel.AddChild(chartsPanel)

            For i = 0 To charts.Length - 1
                Dim chart = charts(i)

                chartsPanel.AddChild(chart)

                chart.Margins = New NMargins(NChartViewSurface.DefaultPanelMargin)

                chartBegin += chartPercentage
            Next

            Return chartViewWithCommandBars
        End Function
        '''
        '''
        '''
        '''
        Public Function CreateExampleControls() As NWidget
            Dim stack As NStackPanel = New NStackPanel()
            Dim group As NUniSizeBoxGroup = New NUniSizeBoxGroup(stack)

            m_PointCountPerChannelComboBox = New NComboBox()
            m_PointCountPerChannelComboBox.Items.Add(New NComboBoxItem("10000"))
            m_PointCountPerChannelComboBox.Items.Add(New NComboBoxItem("20000"))
            m_PointCountPerChannelComboBox.Items.Add(New NComboBoxItem("50000"))
            m_PointCountPerChannelComboBox.Items.Add(New NComboBoxItem("100000"))

            m_PointCountPerChannelComboBox.SelectedIndex = 0

            stack.Add(NPairBox.Create("Point Count Per Channel:", m_PointCountPerChannelComboBox))

            m_EnableShaderRenderingCheckBox = New NCheckBox("Enable Shader Rendering")
            m_EnableShaderRenderingCheckBox.Checked = True
            Me.m_EnableShaderRenderingCheckBox.CheckedChanged += AddressOf OnEnableShaderRenderingCheckBoxCheckedChanged
            stack.Add(m_EnableShaderRenderingCheckBox)

            m_UseCustomColorsCheckBox = New NCheckBox("Use Custom Colors")
            Me.m_UseCustomColorsCheckBox.CheckedChanged += AddressOf OnUseCustomColorsCheckBoxCheckedChanged
            stack.Add(m_UseCustomColorsCheckBox)

            m_StartStopTimerButton = New NButton("Stop Timer")
            Me.m_StartStopTimerButton.Click += AddressOf OnStartStopTimerButtonClick
            stack.Add(m_StartStopTimerButton)

            ' make sure max point count is updated
            Me.m_PointCountPerChannelComboBox.SelectedIndexChanged += AddressOf OnPointCountPerChannelComboBoxSelectedIndexChanged
            OnPointCountPerChannelComboBoxSelectedIndexChanged(Nothing)

            Return group
        End Function
        '''
        '''
        '''
        '''
        Public Function GetExampleDescription() As String
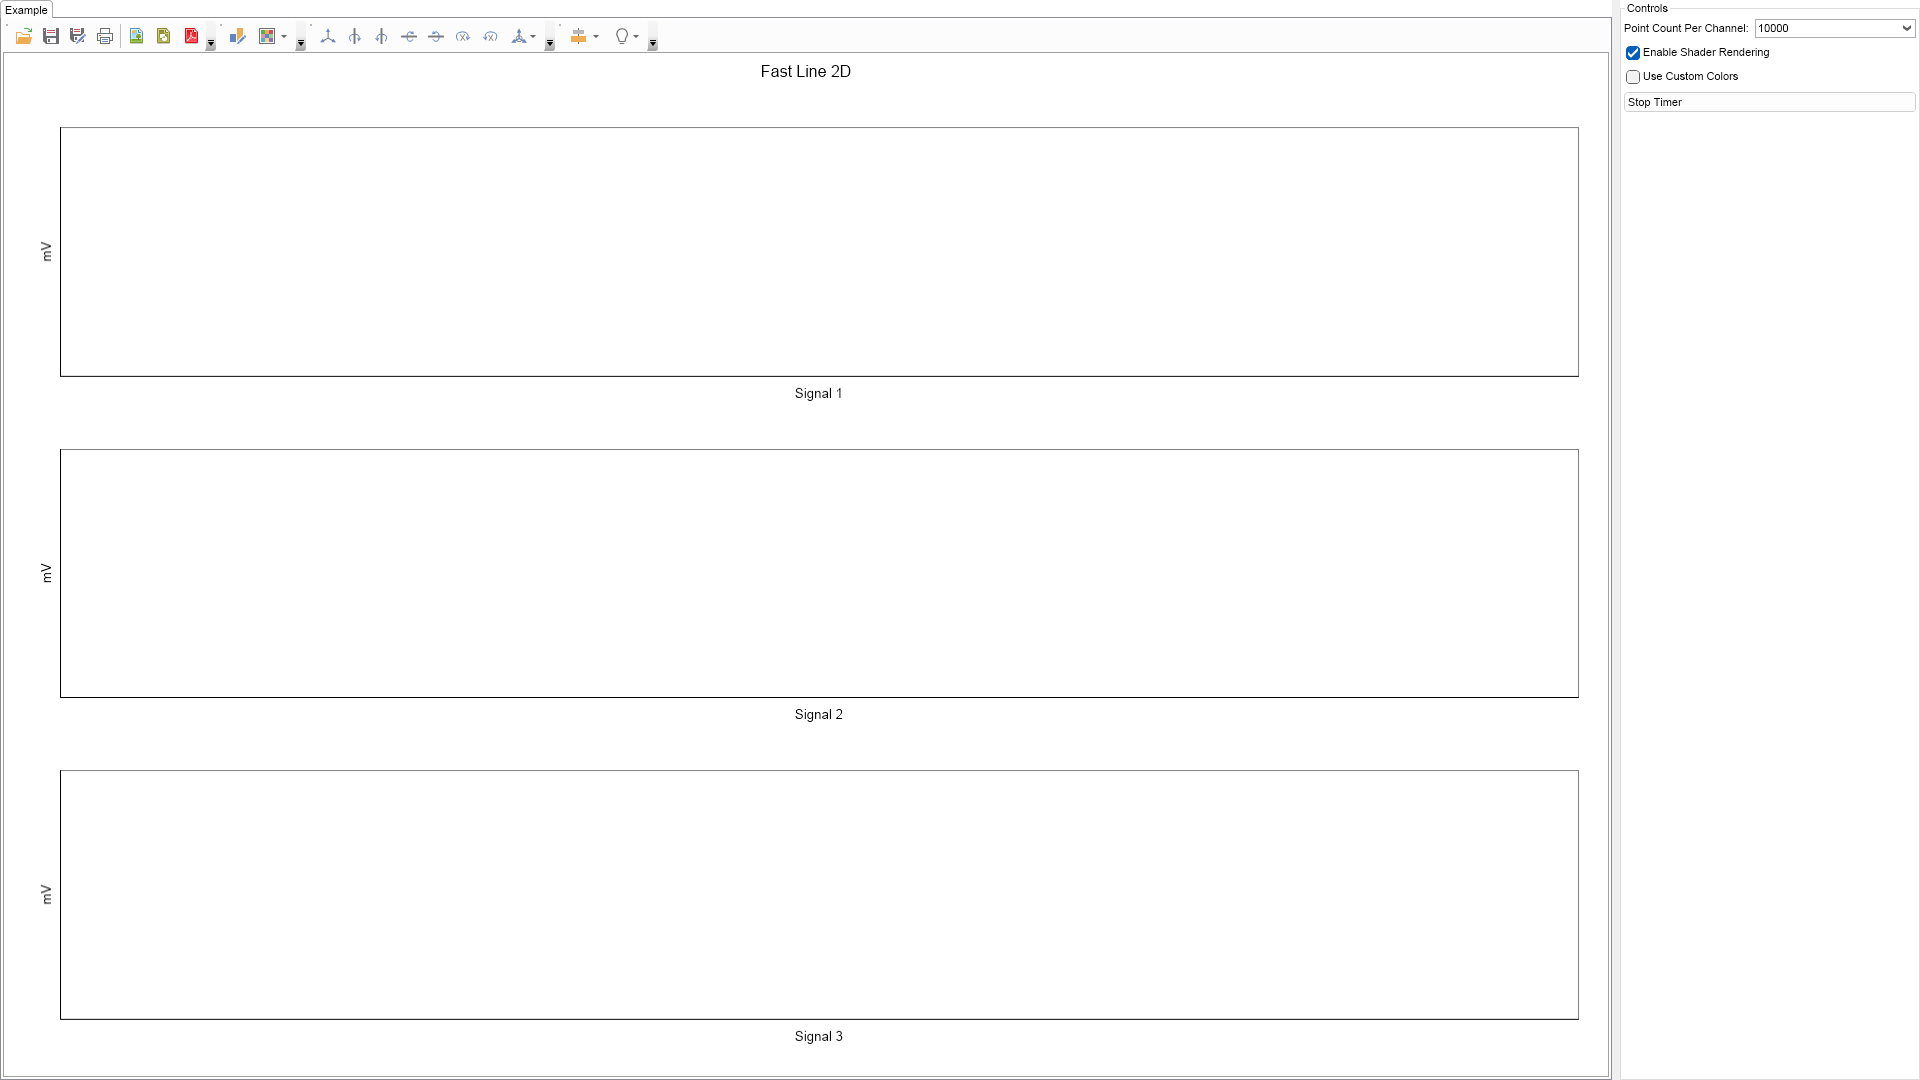
            Return "This example demonstrates how to create a chart containing multiple fast lines series that represent data channels with random data. The fast line series can handle millions of data points in real-time without sampling. "
        End Function

        '''
        ''' Gets the relevant documentation links for the example
        '''
        '''
        Public Function GetDocumentationUrls() As (String, String)()
            Return {("Fast Line Series", "https://www.nevron.com/docs/openvision/fast-line-chart-series.html"), ("Fast Series Overview", "https://www.nevron.com/docs/openvision/fast-chart-series-overview.html"), ("Chart Data Series", "https://www.nevron.com/docs/openvision/chart-data-series.html")}
        End Function

#End Region

#Region "Implementation"

        '''
        ''' Creates a chart
        '''
        '''
        '''
        Private Function CreateChart(channelInfos As NChannelInfo(), signalNumber As Integer) As NCartesianChart
            Dim chart As NCartesianChart = New NCartesianChart()
            chart.FitMode = ENCartesianChartFitMode.Stretch

            ' don't regard axis labels width during fitting
            chart.AxisContentFitMode = ENAxisContentFitMode.LabelsHeight

            ' hide the x/y axes, we're going to use custom axes
            Dim axisX = chart.Axes(ENCartesianAxis.PrimaryX)
            ConfigureLinearScale(axisX, False)
            CType(axisX.Scale, NNumericScale).MinTickDistance = 30

            Dim scaleX = CType(axisX.Scale, NLinearScale)
            scaleX.ViewRangeInflateMode = ENScaleViewRangeInflateMode.None
            scaleX.Title.Text = "Signal " & signalNumber.ToString()

            Dim axisY = chart.Axes(ENCartesianAxis.PrimaryY)
            ConfigureLinearScale(axisY, True)
            axisY.Scale.Title.Text = "mV"

            Dim channelInfoInfo = m_ChannelInfos.Count
            m_ChannelInfos.AddRange(channelInfos)

            For i = 0 To channelInfos.Length - 1
                Dim fastLine As NFastLineSeries = New NFastLineSeries()

                fastLine.EnableShaderRendering = True
                fastLine.DataPointOriginIndex = 0

                fastLine.Data.HasXValues = True

                ' store the channel info index in the tag property
                fastLine.Tag = Math.Min(System.Threading.Interlocked.Increment(channelInfoInfo), channelInfoInfo - 1)

                chart.Series.Add(fastLine)
            Next

            Return chart
        End Function
        '''
        ''' Applies a linear scale and an interlaced stripe at the specified axis
        '''
        '''
        '''
        Private Sub ConfigureLinearScale(axis As NCartesianAxis, vertical As Boolean)
            ' add interlaced stripe to the Y axis
            Dim scale As NLinearScale = New NLinearScale()

            If vertical Then
                scale.MinTickDistance = 25

                Dim stripStyle As NScaleStrip = New NScaleStrip(New NColorFill(NColor.Beige), Nothing, True, 0, 0, 1, 1)
                stripStyle.SetShowAtWall(ENChartWall.Left, True)
                stripStyle.SetShowAtWall(ENChartWall.Back, True)
                stripStyle.SetShowAtWall(ENChartWall.Right, True)
                stripStyle.SetShowAtWall(ENChartWall.Front, True)
                stripStyle.SetShowAtWall(ENChartWall.Bottom, True)
                stripStyle.SetShowAtWall(ENChartWall.Top, True)
                stripStyle.Interlaced = True
                scale.Strips.Add(stripStyle)
            Else
                ' increase the distance between ticks for horizontal axes
                scale.MinTickDistance = 40
            End If

            ' remove label staggering
            scale.Labels.OverlapResolveLayouts = New NDomArray(Of ENLevelLabelsLayout)(New ENLevelLabelsLayout() {ENLevelLabelsLayout.RemoveOverlap})
            axis.Scale = scale
        End Sub

#End Region

#Region "Event Handlers"

        '''
        '''
        '''
        '''
        Private Sub OnChartViewRegistered(arg As NEventArgs)
            m_Timer = New NTimer()
            Me.m_Timer.Tick += AddressOf OnTimerTick
            m_Timer.Start()
        End Sub
        '''
        '''
        '''
        '''
        Private Sub OnChartViewUnregistered(arg As NEventArgs)
            m_Timer.Stop()
            Me.m_Timer.Tick -= AddressOf OnTimerTick
            m_Timer = Nothing
        End Sub
        '''
        '''
        '''
        '''
        '''
        Private Sub OnEnableShaderRenderingCheckBoxCheckedChanged(arg As NValueChangeEventArgs)
            Dim chartView = CType(ExampleContent, NChartViewWithCommandBars)
            Dim charts = chartView.View.Surface.Charts

            For i = 0 To charts.Length - 1
                Dim chart = CType(charts(i), NCartesianChart)

                For j = 0 To chart.Series.Count - 1
                    Dim fastLine As NFastLineSeries = TryCast(chart.Series(j), NFastLineSeries)

                    If fastLine IsNot Nothing Then
                        fastLine.EnableShaderRendering = m_EnableShaderRenderingCheckBox.Checked
                    End If
                Next
            Next
        End Sub
        '''
        '''
        '''
        '''
        '''
        Private Sub OnUseCustomColorsCheckBoxCheckedChanged(arg As NValueChangeEventArgs)
            ResetData()
        End Sub
        '''
        '''
        '''
        Private Sub OnTimerTick()
            AddData()
        End Sub
        '''
        '''
        '''
        '''
        Private Sub OnStartStopTimerButtonClick(args As NEventArgs)
            AddData()

            If m_Timer.IsStarted Then
                m_Timer.Stop()
                m_StartStopTimerButton.Content = New NLabel("Start Timer")
            Else
                m_Timer.Start()
                m_StartStopTimerButton.Content = New NLabel("Stop Timer")
            End If
        End Sub
        '''
        '''
        '''
        '''
        '''
        Private Sub EnableShaderRenderingCheck_CheckedChanged(sender As Object, e As EventArgs)
            Dim chartView = CType(ExampleContent, NChartViewWithCommandBars)
            Dim charts = chartView.View.Surface.Charts

            For i = 0 To charts.Length - 1
                Dim chart = CType(charts(i), NCartesianChart)

                For j = 0 To chart.Series.Count - 1
                    Dim fastLine As NFastLineSeries = TryCast(chart.Series(j), NFastLineSeries)

                    If fastLine IsNot Nothing Then
                        fastLine.EnableShaderRendering = m_EnableShaderRenderingCheckBox.Checked
                    End If
                Next
            Next
        End Sub
        '''
        '''
        '''
        '''
        '''
        Private Sub OnPointCountPerChannelComboBoxSelectedIndexChanged(arg As NValueChangeEventArgs)
            Select Case m_PointCountPerChannelComboBox.SelectedIndex
                Case 0
                    m_MaxPointCount = 10000
                Case 1
                    m_MaxPointCount = 20000
                Case 2
                    m_MaxPointCount = 50000
                Case 3
                    m_MaxPointCount = 100000
                Case Else
                    m_MaxPointCount = 0
            End Select

            ResetData()

            ' m_Title.Text = "Fast Line 2D\r\n Showing Realtime Rendering of " + (m_MaxPointCount * 6).ToString("#,##0", CultureInfo.InvariantCulture) + " Data Points in 6 Channels";
        End Sub

#End Region

#Region "Fields"

            Public ReadOnly AddRandom As Boolean
            Public ReadOnly MinValue As Single
            Public ReadOnly MaxValue As Single
            Public Phase As Single
            Public ReadOnly MinColor As NColor
            Public ReadOnly MaxColor As NColor

            Public CurrentPointIndex As Integer
            Public CurrentXValue As Integer
            Public ReadOnly CycleCount As Integer

#End Region

#Region "Static Methods"
#End Region

#Region "Constants"
#End Region

#Region "Nested Types"
#End Region

End Class

 Chart for .NET
 Diagram for .NET
 User Interface for .NET
 Vision for SSRS
 Chart for SSRS
 Gauge for SSRS
 Map for SSRS
 Barcode for SSRS
 Vision for SharePoint
 Chart for SharePoint
 Gauge for SharePoint
 Map for SharePoint
 Barcode for SharePoint
 Open Vision for .NET


 Vision for .NET