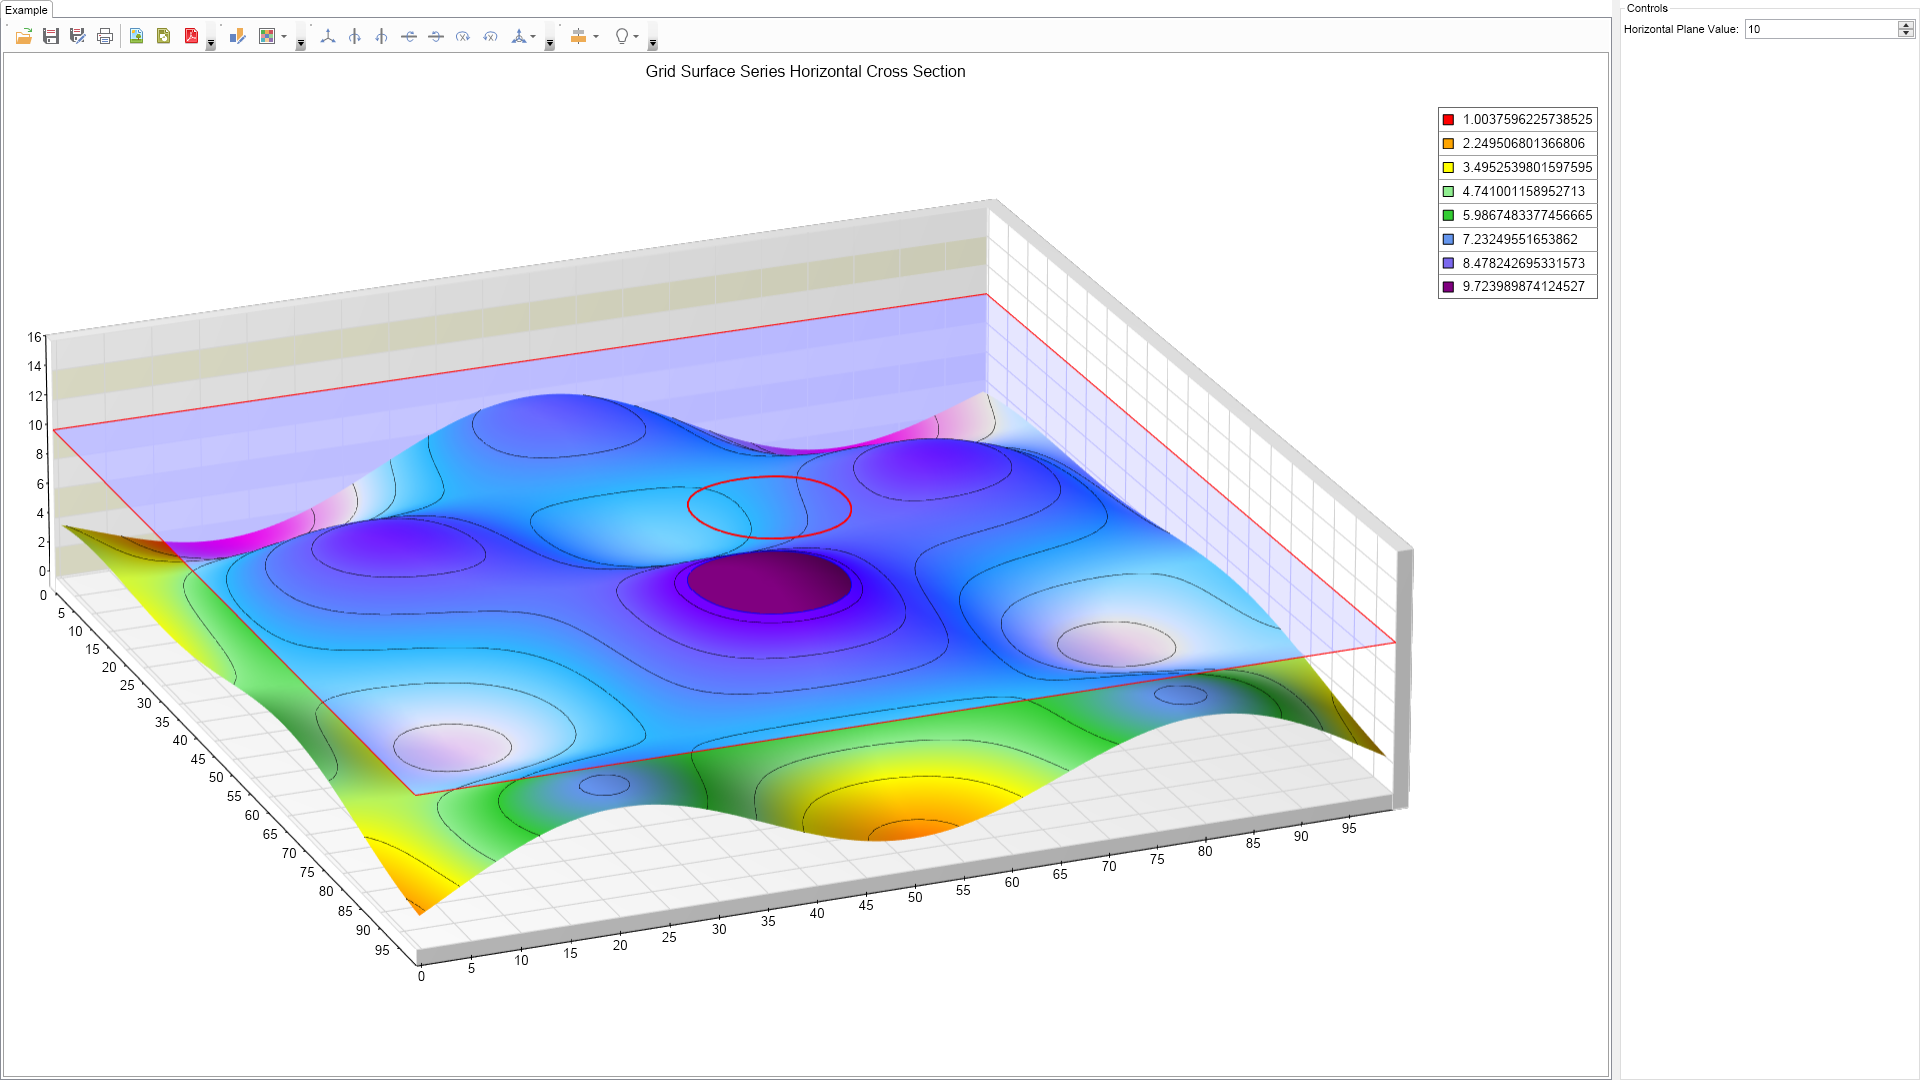
Grid Surface Horizontal Cross Section Example for WinForms

Grid Surface Horizontal Cross Section Example for WinForms

Nevron NOV Chart for WinForms ships with hundreds of examples with full source code, as part of the Nevron Open Vision Suite. All WinForms Chart examples are also available as a stand-alone Visual Studio solution in C# and VB.NET, which you can download from the links below.

Grid Surface Horizontal Cross Section Example for WinForms Description

"This example demonstrates how to extract the cross section of a grid surface at a specified Y value. Adjust the horizontal plane value using the control on the right. The resulting cross section is displayed as both an isoline and a projected contour at the top of the chart.


Grid Surface Horizontal Cross Section Example

C# Grid Surface Horizontal Cross Section Example Code for Nevron Chart for WinForms
Language: C#

using Nevron.Nov;
using Nevron.Nov.Chart;
using Nevron.Nov.Chart.Tools;
using Nevron.Nov.Dom;
using Nevron.Nov.Graphics;
using Nevron.Nov.Layout;
using Nevron.Nov.UI;
using Nevron.Nov.Windows.Forms;
using System;
using System.Windows.Forms;

namespace NovWinFormsProject
{
	public partial class Form1 : Form
	{
		#region Constructors

		public Form1()
		{
			InitializeComponent();

			// Set form title
			Text = "NOV WinForms - NGridSurfaceHorizontalCrossSectionExample";

			// Create the NOV example and its controls
			NWidget exampleContent = CreateExampleContent();
			NWidget exampleControls = CreateExampleControls();
			if (exampleControls != null)
			{
				exampleControls.PreferredWidth = 300;
			}

			// Place the example and its controls in a pair box
			NPairBox pairBox = new NPairBox(exampleContent, exampleControls);
			pairBox.FillMode = ENStackFillMode.First;
			pairBox.FitMode = ENStackFitMode.First;
			pairBox.Margins = new NMargins(NDesign.HorizontalSpacing, NDesign.VerticalSpacing);

			// Host the example in the form
			NNovWidgetHost host = new NNovWidgetHost(pairBox);
			host.Dock = DockStyle.Fill;
			Controls.Add(host);
		}

		#endregion

        #region Example

        /// 
        /// 
        /// 
        /// 
        public NWidget CreateExampleContent()
        {
			NChartViewWithCommandBars chartViewWithCommandBars = new NChartViewWithCommandBars();
			NChartView chartView = chartViewWithCommandBars.View;
			chartView.Surface.CreatePredefinedChart(ENPredefinedChartType.Cartesian);

            // configure title
            chartView.Surface.Titles[0].Text = "Grid Surface Series Horizontal Cross Section";

            // Configure surface chart
            NCartesianChart chart = (NCartesianChart)chartView.Surface.Charts[0];

            chart.Enable3D = true;
            chart.ModelWidth = 60.0f;
            chart.ModelDepth = 60.0f;
            chart.ModelHeight = 15.0f;
            chart.FitMode = ENCartesianChartFitMode.Aspect;
            chart.Projection.SetPredefinedProjection(ENPredefinedProjection.PerspectiveTilted);
            chart.Projection.Elevation = 22;
            chart.Projection.Rotation = -68;
            chart.LightModel.SetPredefinedLightModel(ENPredefinedLightModel.ShinyTopLeft);

            // setup axes
            NOrdinalScale ordinalScale = (NOrdinalScale)chart.Axes[ENCartesianAxis.PrimaryX].Scale;
            ordinalScale.MajorGridLines.SetShowAtWall(ENChartWall.Bottom, true);
            ordinalScale.MajorGridLines.SetShowAtWall(ENChartWall.Back, true);
            ordinalScale.DisplayDataPointsBetweenTicks = false;

            ordinalScale = (NOrdinalScale)chart.Axes[ENCartesianAxis.Depth].Scale;
            ordinalScale.MajorGridLines.SetShowAtWall(ENChartWall.Bottom, true);
            ordinalScale.MajorGridLines.SetShowAtWall(ENChartWall.Left, true);
            ordinalScale.DisplayDataPointsBetweenTicks = false;

            // add interlace stripe to the Y axis
            NLinearScale linearScale = chart.Axes[ENCartesianAxis.PrimaryY].Scale as NLinearScale;
            NScaleStrip stripStyle = new NScaleStrip(new NColorFill(NColor.Beige), null, true, 0, 0, 1, 1);
            stripStyle.Interlaced = true;
            stripStyle.SetShowAtWall(ENChartWall.Back, true);
            stripStyle.SetShowAtWall(ENChartWall.Left, true);
            linearScale.Strips.Add(stripStyle);

            chart.Axes[ENCartesianAxis.PrimaryY].SetFixedViewRange(new NRange(0, 15.001));

            // add the surface series
            m_SurfaceSeries = new NGridSurfaceSeries();
            chart.Series.Add(m_SurfaceSeries);
            m_SurfaceSeries.Name = "Surface";
            m_SurfaceSeries.LegendView.Mode = ENSeriesLegendMode.SeriesLogic;
            m_SurfaceSeries.FlatPositionValue = 10.0;
            m_SurfaceSeries.Data.SetGridSize(100, 100);
            m_SurfaceSeries.Fill = new NColorFill(NColor.YellowGreen);
            m_SurfaceSeries.ShadingMode = ENShadingMode.Smooth;
            m_SurfaceSeries.FillColorMode = ENColorMode.Zone;
            m_SurfaceSeries.ContourLines.Add(new NContourLine(10, new NStroke(2.0f, NColor.Blue)));

            m_ContourLineSeries = new NLineSeries();
            chart.Series.Add(m_ContourLineSeries);

            m_ContourLineSeries.UseXValues = true;
            m_ContourLineSeries.UseZValues = true;
            m_ContourLineSeries.Stroke = new NStroke(2, NColor.Red);

            m_ContourLineSeries.DataLabelStyle = new NDataLabelStyle(false);
            m_ContourLineSeries.LegendView.Mode = ENSeriesLegendMode.None;

            m_CrossSectionPlane = new NAxisReferenceLine();
            m_CrossSectionPlane.DisplayMode = ENReferenceLineDisplayMode.Plane;
            m_CrossSectionPlane.Fill = new NColorFill(NColor.FromARGB(25, 0, 0, 255));
            chart.Axes[ENCartesianAxis.PrimaryY].ReferenceLines.Add(m_CrossSectionPlane);

            FillData(m_SurfaceSeries);

            // make sure min / max for all axes is calculated
            chartView.Document.Evaluate();

            chart.Interactor = new NInteractor(new NTool[] { new NTrackballTool() });

            return chartViewWithCommandBars;
        }
        /// 
        /// 
        /// 
        /// 
        private void FillData(NGridSurfaceSeries surface)
        {
            double y, x, z;
            int nCountX = surface.Data.GridSizeX;
            int nCountZ = surface.Data.GridSizeZ;

            const double dIntervalX = 10.0;
            const double dIntervalZ = 10.0;
            double dIncrementX = (dIntervalX / nCountX);
            double dIncrementZ = (dIntervalZ / nCountZ);

            z = -(dIntervalZ / 2);

            for (int j = 0; j < nCountZ; j++, z += dIncrementZ)
            {
                x = -(dIntervalX / 2);

                for (int i = 0; i < nCountX; i++, x += dIncrementX)
                {
                    y = 10 - Math.Sqrt((x * x) + (z * z) + 2);
                    y += 3.0 * Math.Sin(x) * Math.Cos(z);

                    surface.Data.SetValue(i, j, y);
                }
            }
        }

        public NWidget CreateExampleControls()
        {
            NStackPanel stack = new NStackPanel();
            NUniSizeBoxGroup group = new NUniSizeBoxGroup(stack);

            NNumericUpDown horizontalPlaneValueUpDown = new NNumericUpDown();
            stack.Add(NPairBox.Create("Horizontal Plane Value:", horizontalPlaneValueUpDown));
            horizontalPlaneValueUpDown.ValueChanged += OnHorizontalPlaneValueValueChanged;
            horizontalPlaneValueUpDown.Value = 10;
            horizontalPlaneValueUpDown.Minimum = 0;
            horizontalPlaneValueUpDown.Maximum = m_ContourYValue;

            return group;
        }

        public string GetExampleDescription()
        {
            return @"

""This example demonstrates how to extract the cross section of a grid surface at a specified Y value. Adjust the horizontal plane value using the control on the right. The resulting cross section is displayed as both an isoline and a projected contour at the top of the chart.

"; } /// /// Gets the relevant documentation links for the example /// /// public (string Name, string Url)[] GetDocumentationUrls() { return new[] { ("Grid Surface Series", "https://www.nevron.com/docs/openvision/grid-surface-chart-series.html"), ("Surface Series Overview", "https://www.nevron.com/docs/openvision/surface-chart-series-overview.html"), ("3D Charts", "https://www.nevron.com/docs/openvision/3d-charts.html"), ("Common Series Functionality", "https://www.nevron.com/docs/openvision/chart-common-series-functionality.html"), }; } #endregion #region Implementation #endregion #region Event Handlers #endregion #region Fields NGridSurfaceSeries m_SurfaceSeries; NLineSeries m_ContourLineSeries; NAxisReferenceLine m_CrossSectionPlane; const double m_ContourYValue = 15; #endregion #region Static Methods #endregion #region Constants #endregion #region Nested Types #endregion } }

Download a fully functional C# (.cs) Grid Surface Horizontal Cross Section Example for WinForms Solution

VB.NET Grid Surface Horizontal Cross Section Example Code for Nevron Chart for WinForms
Language: VB.NET

Imports Nevron.Nov
Imports Nevron.Nov.Chart
Imports Nevron.Nov.Chart.Tools
Imports Nevron.Nov.Dom
Imports Nevron.Nov.Graphics
Imports Nevron.Nov.Layout
Imports Nevron.Nov.UI
Imports Nevron.Nov.Windows.Forms
Imports System

Public Class Form1

#Region "Constructors"

    Public Sub New()
        ' This call is required by the designer.
        InitializeComponent()

        ' Add any initialization after the InitializeComponent() call.

        ' Set form title
        Text = "NOV WinForms - NGridSurfaceHorizontalCrossSectionExample"

        ' Create the NOV example and its controls
        Dim exampleContent As NWidget = CreateExampleContent()
        Dim exampleControls As NWidget = CreateExampleControls()
        If Not exampleControls Is Nothing Then
            exampleControls.PreferredWidth = 300
        End If

        ' Place the example and its controls in a pair box
        Dim pairBox As NPairBox = New NPairBox(exampleContent, exampleControls)
        pairBox.FillMode = ENStackFillMode.First
        pairBox.FitMode = ENStackFitMode.First
        pairBox.Margins = New NMargins(NDesign.HorizontalSpacing, NDesign.VerticalSpacing)

        ' Host the example in the form
        Dim host As NNovWidgetHost(Of NWidget) = New NNovWidgetHost(Of NWidget)(pairBox)
        host.Dock = DockStyle.Fill
        Controls.Add(host)
    End Sub


#End Region

#Region "Example"

        ''' 
        ''' 
        ''' 
        ''' 
        Public Function CreateExampleContent() As NWidget
            Dim chartViewWithCommandBars As NChartViewWithCommandBars = New NChartViewWithCommandBars()
            Dim chartView = chartViewWithCommandBars.View
            chartView.Surface.CreatePredefinedChart(ENPredefinedChartType.Cartesian)

            ' configure title
            chartView.Surface.Titles(0).Text = "Grid Surface Series Horizontal Cross Section"

            ' Configure surface chart
            Dim chart = CType(chartView.Surface.Charts(0), NCartesianChart)

            chart.Enable3D = True
            chart.ModelWidth = 60.0F
            chart.ModelDepth = 60.0F
            chart.ModelHeight = 15.0F
            chart.FitMode = ENCartesianChartFitMode.Aspect
            chart.Projection.SetPredefinedProjection(ENPredefinedProjection.PerspectiveTilted)
            chart.Projection.Elevation = 22
            chart.Projection.Rotation = -68
            chart.LightModel.SetPredefinedLightModel(ENPredefinedLightModel.ShinyTopLeft)

            ' setup axes
            Dim ordinalScale As NOrdinalScale = chart.Axes(ENCartesianAxis.PrimaryX).Scale
            ordinalScale.MajorGridLines.SetShowAtWall(ENChartWall.Bottom, True)
            ordinalScale.MajorGridLines.SetShowAtWall(ENChartWall.Back, True)
            ordinalScale.DisplayDataPointsBetweenTicks = False

            ordinalScale = chart.Axes(ENCartesianAxis.Depth).Scale
            ordinalScale.MajorGridLines.SetShowAtWall(ENChartWall.Bottom, True)
            ordinalScale.MajorGridLines.SetShowAtWall(ENChartWall.Left, True)
            ordinalScale.DisplayDataPointsBetweenTicks = False

            ' add interlace stripe to the Y axis
            Dim linearScale As NLinearScale = TryCast(chart.Axes(ENCartesianAxis.PrimaryY).Scale, NLinearScale)
            Dim stripStyle As NScaleStrip = New NScaleStrip(New NColorFill(NColor.Beige), Nothing, True, 0, 0, 1, 1)
            stripStyle.Interlaced = True
            stripStyle.SetShowAtWall(ENChartWall.Back, True)
            stripStyle.SetShowAtWall(ENChartWall.Left, True)
            linearScale.Strips.Add(stripStyle)

            chart.Axes(ENCartesianAxis.PrimaryY).SetFixedViewRange(New NRange(0, 15.001))

            ' add the surface series
            m_SurfaceSeries = New NGridSurfaceSeries()
            chart.Series.Add(m_SurfaceSeries)
            m_SurfaceSeries.Name = "Surface"
            m_SurfaceSeries.LegendView.Mode = ENSeriesLegendMode.SeriesLogic
            m_SurfaceSeries.FlatPositionValue = 10.0
            m_SurfaceSeries.Data.SetGridSize(100, 100)
            m_SurfaceSeries.Fill = New NColorFill(NColor.YellowGreen)
            m_SurfaceSeries.ShadingMode = ENShadingMode.Smooth
            m_SurfaceSeries.FillColorMode = ENColorMode.Zone
            m_SurfaceSeries.ContourLines.Add(New NContourLine(10, New NStroke(2.0F, NColor.Blue)))

            m_ContourLineSeries = New NLineSeries()
            chart.Series.Add(m_ContourLineSeries)

            m_ContourLineSeries.UseXValues = True
            m_ContourLineSeries.UseZValues = True
            m_ContourLineSeries.Stroke = New NStroke(2, NColor.Red)

            m_ContourLineSeries.DataLabelStyle = New NDataLabelStyle(False)
            m_ContourLineSeries.LegendView.Mode = ENSeriesLegendMode.None

            m_CrossSectionPlane = New NAxisReferenceLine()
            m_CrossSectionPlane.DisplayMode = ENReferenceLineDisplayMode.Plane
            m_CrossSectionPlane.Fill = New NColorFill(NColor.FromARGB(25, 0, 0, 255))
            chart.Axes(ENCartesianAxis.PrimaryY).ReferenceLines.Add(m_CrossSectionPlane)

            FillData(m_SurfaceSeries)

            ' make sure min / max for all axes is calculated
            chartView.Document.Evaluate()

            chart.Interactor = New NInteractor(New NTool() {New NTrackballTool()})

            Return chartViewWithCommandBars
        End Function
        ''' 
        ''' 
        ''' 
        ''' 
        Private Sub FillData(surface As NGridSurfaceSeries)
            Dim y, x, z As Double
            Dim nCountX = surface.Data.GridSizeX
            Dim nCountZ = surface.Data.GridSizeZ

            Const dIntervalX = 10.0
            Const dIntervalZ = 10.0
            Dim dIncrementX = dIntervalX / nCountX
            Dim dIncrementZ = dIntervalZ / nCountZ

            z = -(dIntervalZ / 2)

            Dim j = 0

            While j < nCountZ
                x = -(dIntervalX / 2)

                Dim i = 0

                While i < nCountX
                    y = 10 - Math.Sqrt(x * x + z * z + 2)
                    y += 3.0 * Math.Sin(x) * Math.Cos(z)

                    surface.Data.SetValue(i, j, y)
                    i += 1
                    x += dIncrementX
                End While

                j += 1
                z += dIncrementZ
            End While
        End Sub

        Public Function CreateExampleControls() As NWidget
            Dim stack As NStackPanel = New NStackPanel()
            Dim group As NUniSizeBoxGroup = New NUniSizeBoxGroup(stack)

            Dim horizontalPlaneValueUpDown As NNumericUpDown = New NNumericUpDown()
            stack.Add(NPairBox.Create("Horizontal Plane Value:", horizontalPlaneValueUpDown))
            horizontalPlaneValueUpDown.ValueChanged += AddressOf OnHorizontalPlaneValueValueChanged
            horizontalPlaneValueUpDown.Value = 10
            horizontalPlaneValueUpDown.Minimum = 0
            horizontalPlaneValueUpDown.Maximum = m_ContourYValue

            Return group
        End Function

        Public Function GetExampleDescription() As String
            Return "

""This example demonstrates how to extract the cross section of a grid surface at a specified Y value. Adjust the horizontal plane value using the control on the right. The resulting cross section is displayed as both an isoline and a projected contour at the top of the chart.

" End Function ''' ''' Gets the relevant documentation links for the example ''' ''' Public Function GetDocumentationUrls() As (String, String)() Return {("Grid Surface Series", "https://www.nevron.com/docs/openvision/grid-surface-chart-series.html"), ("Surface Series Overview", "https://www.nevron.com/docs/openvision/surface-chart-series-overview.html"), ("3D Charts", "https://www.nevron.com/docs/openvision/3d-charts.html"), ("Common Series Functionality", "https://www.nevron.com/docs/openvision/chart-common-series-functionality.html")} End Function #End Region #Region "Implementation" #End Region #Region "Event Handlers" #End Region #Region "Fields" Private m_SurfaceSeries As NGridSurfaceSeries Private m_ContourLineSeries As NLineSeries Private m_CrossSectionPlane As NAxisReferenceLine Const m_ContourYValue As Double = 15 #End Region #Region "Static Methods" #End Region #Region "Constants" #End Region #Region "Nested Types" #End Region End Class

Download a fully functional VB.NET (.vb) Grid Surface Horizontal Cross Section Example for WinForms Solution