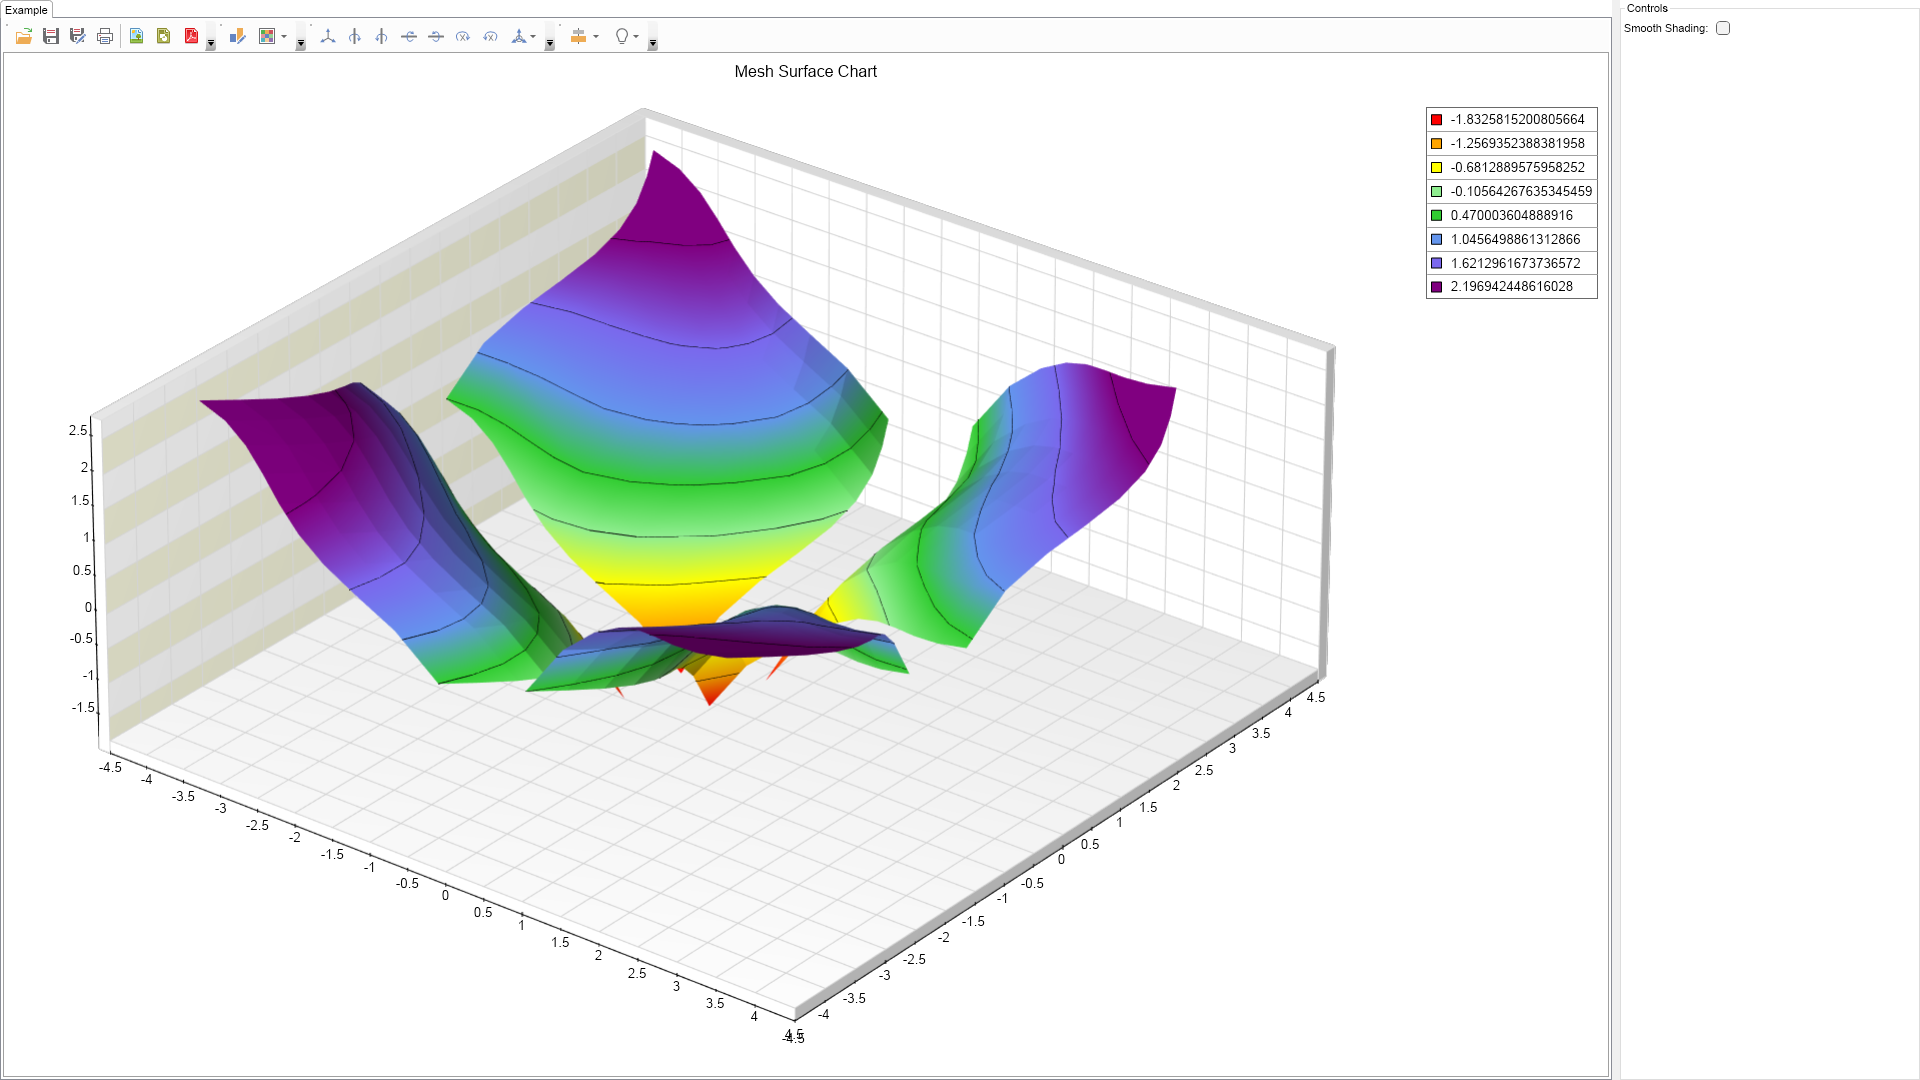
Imports Nevron.Nov
Imports Nevron.Nov.Chart
Imports Nevron.Nov.Chart.Tools
Imports Nevron.Nov.Dom
Imports Nevron.Nov.Graphics
Imports Nevron.Nov.Layout
Imports Nevron.Nov.UI
Imports Nevron.Nov.Windows.Forms
Imports System
Public Class Form1
#Region "Constructors"
Public Sub New()
' This call is required by the designer.
InitializeComponent()
' Add any initialization after the InitializeComponent() call.
' Set form title
Text = "NOV WinForms - NMeshSurfaceEmptyDataPointsExample"
' Create the NOV example and its controls
Dim exampleContent As NWidget = CreateExampleContent()
Dim exampleControls As NWidget = CreateExampleControls()
If Not exampleControls Is Nothing Then
exampleControls.PreferredWidth = 300
End If
' Place the example and its controls in a pair box
Dim pairBox As NPairBox = New NPairBox(exampleContent, exampleControls)
pairBox.FillMode = ENStackFillMode.First
pairBox.FitMode = ENStackFitMode.First
pairBox.Margins = New NMargins(NDesign.HorizontalSpacing, NDesign.VerticalSpacing)
' Host the example in the form
Dim host As NNovWidgetHost(Of NWidget) = New NNovWidgetHost(Of NWidget)(pairBox)
host.Dock = DockStyle.Fill
Controls.Add(host)
End Sub
#End Region
#Region "Example"
Public Function CreateExampleContent() As NWidget
Dim chartViewWithCommandBars As NChartViewWithCommandBars = New NChartViewWithCommandBars()
Dim chartView = chartViewWithCommandBars.View
chartView.Surface.CreatePredefinedChart(ENPredefinedChartType.Cartesian)
' configure title
chartView.Surface.Titles(0).Text = "Mesh Surface Chart"
' setup chart
Dim chart = CType(chartView.Surface.Charts(0), NCartesianChart)
m_Chart = chart
chart.Enable3D = True
chart.ModelWidth = 60.0F
chart.ModelDepth = 60.0F
chart.ModelHeight = 25.0F
chart.Projection.SetPredefinedProjection(ENPredefinedProjection.PerspectiveTilted)
chart.LightModel.SetPredefinedLightModel(ENPredefinedLightModel.SoftTopLeft)
chart.Interactor = New NInteractor(New NTrackballTool())
Dim scale As NLinearScale = chart.Axes(ENCartesianAxis.PrimaryY).Scale
scale.ViewRangeInflateMode = ENScaleViewRangeInflateMode.None
' setup axes
Dim scaleX As NLinearScale = New NLinearScale()
chart.Axes(ENCartesianAxis.PrimaryX).Scale = scaleX
scaleX.MajorGridLines.SetShowAtWall(ENChartWall.Bottom, True)
scaleX.MajorGridLines.SetShowAtWall(ENChartWall.Back, True)
Dim scaleZ As NLinearScale = New NLinearScale()
chart.Axes(ENCartesianAxis.Depth).Scale = scaleZ
scaleZ.MajorGridLines.SetShowAtWall(ENChartWall.Bottom, True)
scaleZ.MajorGridLines.SetShowAtWall(ENChartWall.Left, True)
' add interlace stripe to the Y axis
Dim linearScale As NLinearScale = TryCast(chart.Axes(ENCartesianAxis.PrimaryY).Scale, NLinearScale)
Dim stripStyle As NScaleStrip = New NScaleStrip(New NColorFill(NColor.Beige), Nothing, True, 0, 0, 1, 1)
stripStyle.Interlaced = True
stripStyle.SetShowAtWall(ENChartWall.Back, True)
stripStyle.SetShowAtWall(ENChartWall.Left, True)
linearScale.Strips.Add(stripStyle)
' add the surface series
m_Surface = New NMeshSurfaceSeries()
chart.Series.Add(m_Surface)
m_Surface.Name = "Surface"
m_Surface.LegendView.Mode = ENSeriesLegendMode.SeriesLogic
m_Surface.FillColorMode = ENColorMode.Zone
m_Surface.ShowFrame = True
m_Surface.FlatPositionValue = 0.5
m_Surface.Data.SetGridSize(20, 20)
m_Surface.Fill = New NColorFill(NColor.YellowGreen)
FillData(m_Surface)
Return chartViewWithCommandBars
End Function
Private Sub FillData(surface As NMeshSurfaceSeries)
Dim x, y, z As Double
Dim nCountX = surface.Data.GridSizeX
Dim nCountZ = surface.Data.GridSizeZ
Const dIntervalX = 8.0
Const dIntervalZ = 8.0
Dim dIncrementX = dIntervalX / nCountX
Dim dIncrementZ = dIntervalZ / nCountZ
For j = 0 To nCountZ - 1
For i = 0 To nCountX - 1
x = -(dIntervalX / 2) + i * dIncrementX
z = -(dIntervalZ / 2) + j * dIncrementZ
y = Math.Log(Math.Abs(x) * Math.Abs(z))
x += Math.Sin(j / 2.0) / 2.2
z += Math.Cos(i / 2.0) / 2.2
If y > -7 Then
surface.Data.SetValue(i, j, y, x, z)
Else
surface.Data.SetValue(i, j, DBNull.Value, DBNull.Value, DBNull.Value)
End If
Next
Next
End Sub
Public Function CreateExampleControls() As NWidget
Dim stack As NStackPanel = New NStackPanel()
Dim group As NUniSizeBoxGroup = New NUniSizeBoxGroup(stack)
Dim smoothShadingCheckBox As NCheckBox = New NCheckBox()
smoothShadingCheckBox.CheckedChanged += AddressOf OnSmoothShadingCheckBoxCheckedChanged
smoothShadingCheckBox.Checked = False
smoothShadingCheckBox.HorizontalPlacement = Layout.ENHorizontalPlacement.Left
stack.Add(NPairBox.Create("Smooth Shading:", smoothShadingCheckBox))
Return group
End Function
Private Sub OnSmoothShadingCheckBoxCheckedChanged(arg As NValueChangeEventArgs)
m_Surface.ShadingMode = If(arg.NewValue, ENShadingMode.Smooth, ENShadingMode.Flat)
End Sub
Public Function GetExampleDescription() As String
Return "This example demonstrates the mesh surface support for Empty Data Points.
"
End Function
'''
''' Gets the relevant documentation links for the example
'''
'''
Public Function GetDocumentationUrls() As (String, String)()
Return {("Mesh Surface Series", "https://www.nevron.com/docs/openvision/mesh-surface-chart-series.html"), ("Surface Series Overview", "https://www.nevron.com/docs/openvision/surface-chart-series-overview.html"), ("3D Charts", "https://www.nevron.com/docs/openvision/3d-charts.html")}
End Function
#End Region
#Region "Implementation"
#End Region
#Region "Event Handlers"
#End Region
#Region "Fields"
Private m_Chart As NChart
Private m_Surface As NMeshSurfaceSeries
#End Region
#Region "Static Methods"
#End Region
#Region "Constants"
#End Region
#Region "Nested Types"
#End Region
End Class

 Chart for .NET
 Diagram for .NET
 User Interface for .NET
 Vision for SSRS
 Chart for SSRS
 Gauge for SSRS
 Map for SSRS
 Barcode for SSRS
 Vision for SharePoint
 Chart for SharePoint
 Gauge for SharePoint
 Map for SharePoint
 Barcode for SharePoint
 Open Vision for .NET


 Vision for .NET