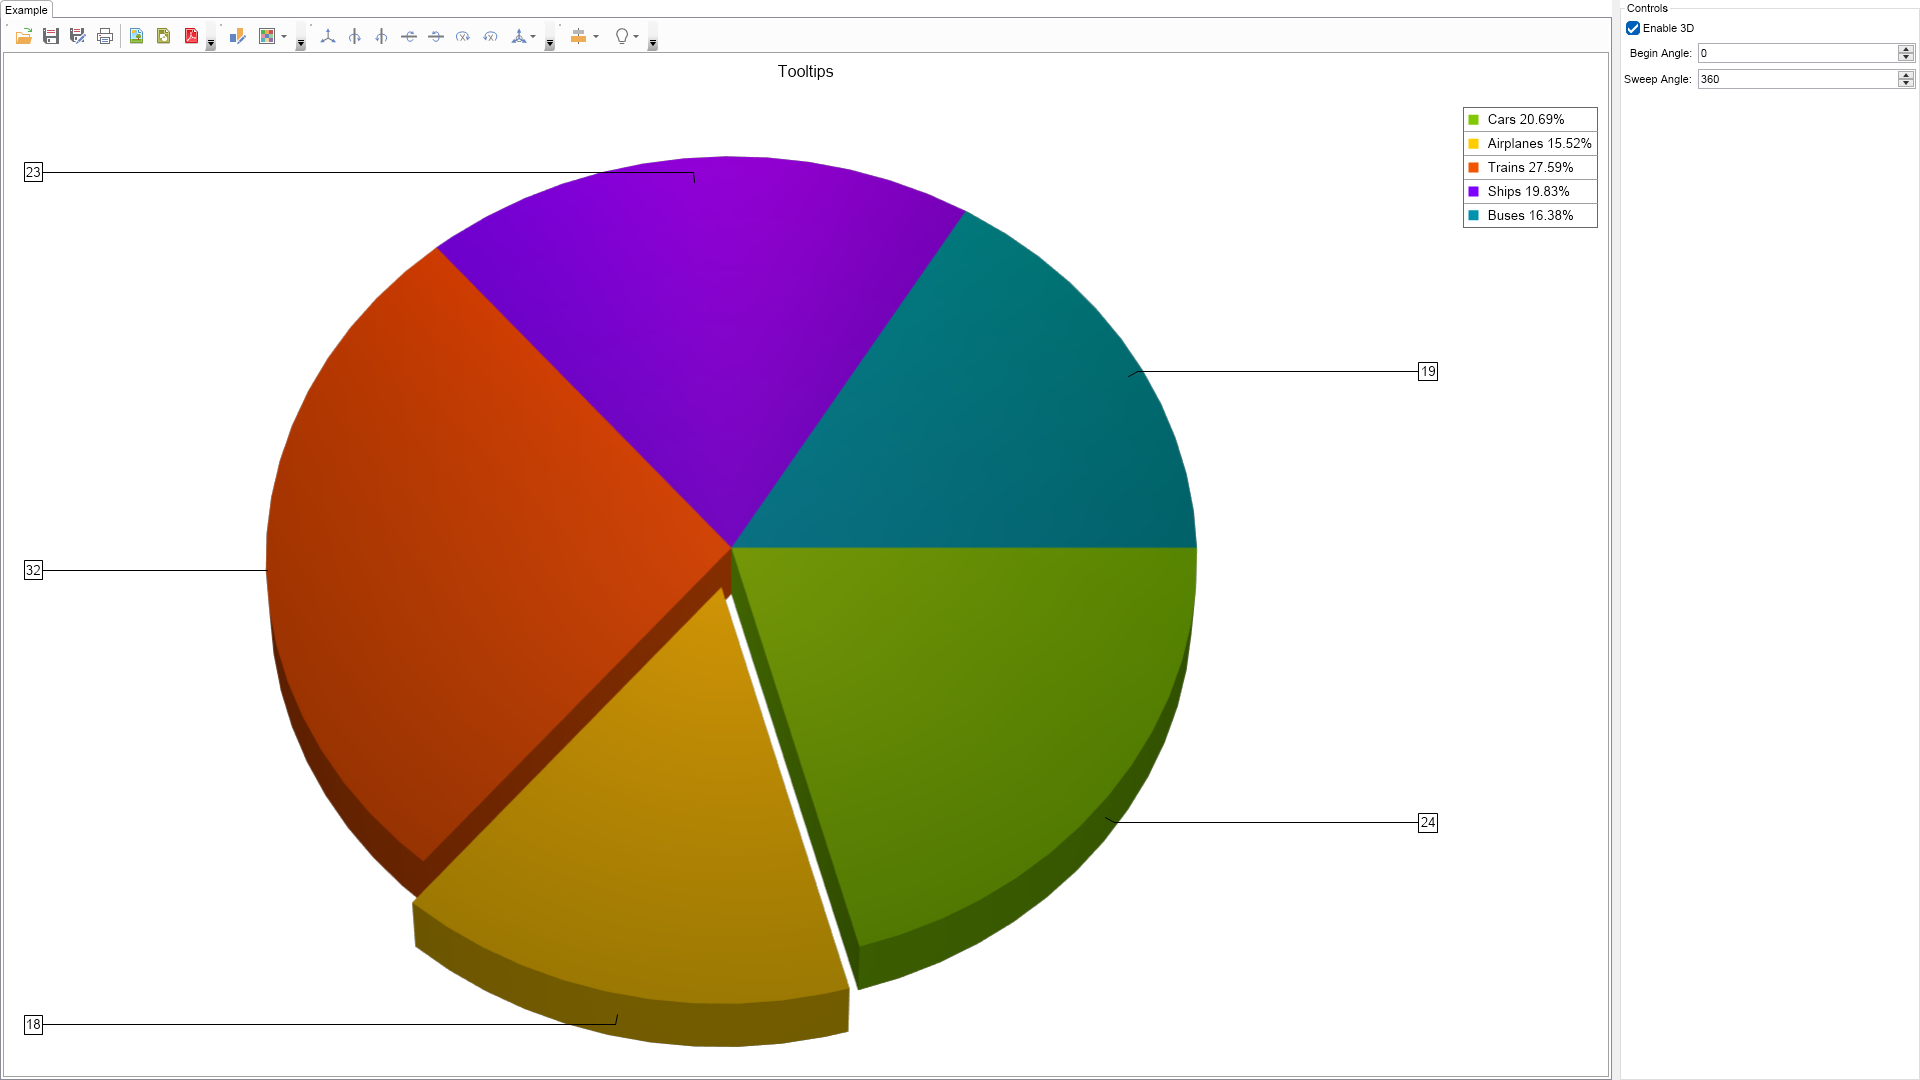
This example demonstrates how to create tooltips attached to chart objects.

| Language: C# |
using Nevron.Nov;
using Nevron.Nov.Chart;
using Nevron.Nov.Chart.Tools;
using Nevron.Nov.Dom;
using Nevron.Nov.Graphics;
using Nevron.Nov.Layout;
using Nevron.Nov.UI;
using Nevron.Nov.Windows.Forms;
using System.Windows.Forms;
namespace NovWinFormsProject
{
public partial class Form1 : Form
{
#region Constructors
public Form1()
{
InitializeComponent();
// Set form title
Text = "NOV WinForms - NTooltipsExample";
// Create the NOV example and its controls
NWidget exampleContent = CreateExampleContent();
NWidget exampleControls = CreateExampleControls();
if (exampleControls != null)
{
exampleControls.PreferredWidth = 300;
}
// Place the example and its controls in a pair box
NPairBox pairBox = new NPairBox(exampleContent, exampleControls);
pairBox.FillMode = ENStackFillMode.First;
pairBox.FitMode = ENStackFitMode.First;
pairBox.Margins = new NMargins(NDesign.HorizontalSpacing, NDesign.VerticalSpacing);
// Host the example in the form
NNovWidgetHost host = new NNovWidgetHost(pairBox);
host.Dock = DockStyle.Fill;
Controls.Add(host);
}
#endregion
#region Example
public NWidget CreateExampleContent()
{
NChartViewWithCommandBars chartViewWithCommandBars = new NChartViewWithCommandBars();
NChartView chartView = chartViewWithCommandBars.View;
chartView.Surface.CreatePredefinedChart(ENPredefinedChartType.Pie);
// configure title
chartView.Surface.Titles[0].Text = "Tooltips";
// configure chart
m_PieChart = (NPieChart)chartView.Surface.Charts[0];
m_PieChart.Enable3D = true;
m_PieChart.EnableInteractivity = true;
m_PieChart.Projection.SetPredefinedProjection(ENPredefinedProjection.PerspectiveElevated);
m_PieChart.LightModel.SetPredefinedLightModel(ENPredefinedLightModel.Arena);
m_PieChart.Interactor = new NInteractor(new NTrackballTool());
m_PieSeries = new NPieSeries();
m_PieChart.Series.Add(m_PieSeries);
m_PieChart.DockSpiderLabelsToSides = true;
NDataLabelStyle dataLabelStyle = new NDataLabelStyle();
dataLabelStyle.ArrowLength = 15;
dataLabelStyle.ArrowPointerLength = 0;
m_PieSeries.DataLabelStyle = dataLabelStyle;
m_PieSeries.LabelMode = ENPieLabelMode.Spider;
m_PieSeries.LegendView.Mode = ENSeriesLegendMode.DataPoints;
m_PieSeries.LegendView.Format = " | Language: VB.NET |
Imports Nevron.Nov
Imports Nevron.Nov.Chart
Imports Nevron.Nov.Chart.Tools
Imports Nevron.Nov.Dom
Imports Nevron.Nov.Graphics
Imports Nevron.Nov.Layout
Imports Nevron.Nov.UI
Imports Nevron.Nov.Windows.Forms
Public Class Form1
#Region "Constructors"
Public Sub New()
' This call is required by the designer.
InitializeComponent()
' Add any initialization after the InitializeComponent() call.
' Set form title
Text = "NOV WinForms - NTooltipsExample"
' Create the NOV example and its controls
Dim exampleContent As NWidget = CreateExampleContent()
Dim exampleControls As NWidget = CreateExampleControls()
If Not exampleControls Is Nothing Then
exampleControls.PreferredWidth = 300
End If
' Place the example and its controls in a pair box
Dim pairBox As NPairBox = New NPairBox(exampleContent, exampleControls)
pairBox.FillMode = ENStackFillMode.First
pairBox.FitMode = ENStackFitMode.First
pairBox.Margins = New NMargins(NDesign.HorizontalSpacing, NDesign.VerticalSpacing)
' Host the example in the form
Dim host As NNovWidgetHost(Of NWidget) = New NNovWidgetHost(Of NWidget)(pairBox)
host.Dock = DockStyle.Fill
Controls.Add(host)
End Sub
#End Region
#Region "Example"
Public Function CreateExampleContent() As NWidget
Dim chartViewWithCommandBars As NChartViewWithCommandBars = New NChartViewWithCommandBars()
Dim chartView = chartViewWithCommandBars.View
chartView.Surface.CreatePredefinedChart(ENPredefinedChartType.Pie)
' configure title
chartView.Surface.Titles(0).Text = "Tooltips"
' configure chart
m_PieChart = CType(chartView.Surface.Charts(0), NPieChart)
m_PieChart.Enable3D = True
m_PieChart.EnableInteractivity = True
m_PieChart.Projection.SetPredefinedProjection(ENPredefinedProjection.PerspectiveElevated)
m_PieChart.LightModel.SetPredefinedLightModel(ENPredefinedLightModel.Arena)
m_PieChart.Interactor = New NInteractor(New NTrackballTool())
m_PieSeries = New NPieSeries()
m_PieChart.Series.Add(m_PieSeries)
m_PieChart.DockSpiderLabelsToSides = True
Dim dataLabelStyle As NDataLabelStyle = New NDataLabelStyle()
dataLabelStyle.ArrowLength = 15
dataLabelStyle.ArrowPointerLength = 0
m_PieSeries.DataLabelStyle = dataLabelStyle
m_PieSeries.LabelMode = ENPieLabelMode.Spider
m_PieSeries.LegendView.Mode = ENSeriesLegendMode.DataPoints
m_PieSeries.LegendView.Format = "