
ProductsAll Products
.NET Components
 Open Vision for .NET
 NOV Chart for .NET
 NOV Diagram for .NET
 NOV Rich Text Editor for .NET
 NOV Grid for .NET
 NOV Schedule for .NET
 NOV Gauge for .NET
 NOV Barcode for .NET
 NOV User Interface for .NET
 Vision for .NET
 Chart for .NET
 Diagram for .NET
 User Interface for .NET
 Vision for SSRS
 Chart for SSRS
 Gauge for SSRS
 Map for SSRS
 Barcode for SSRS
 Vision for SharePoint
 Chart for SharePoint
 Gauge for SharePoint
 Map for SharePoint
 Barcode for SharePoint
DownloadsAll Downloads
NOV Chart for .NET is a powerful charting framework for creating professional financial applications with C# and .NET. It provides the performance, flexibility, and customization required to transform market data into clear, interactive financial charts.
Developers can use NOV Chart to build stock-market dashboards, trading applications, portfolio-analysis tools, and automated financial reports for WinForms, WPF, Blazor, and macOS from a single code base.
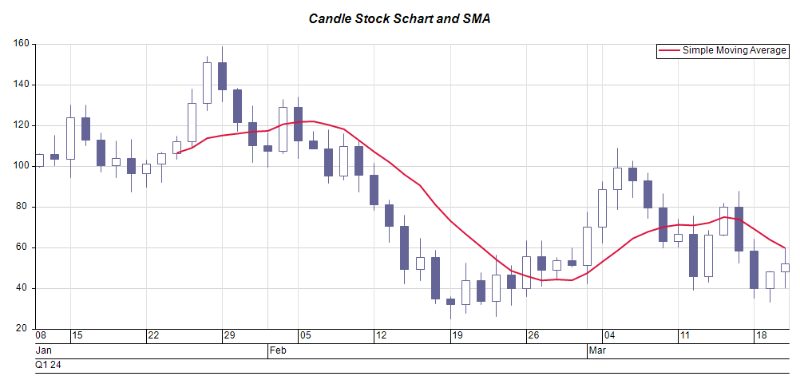
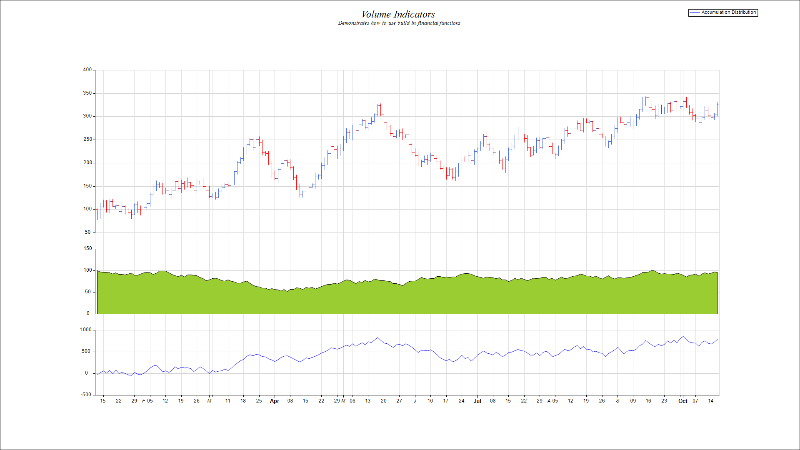
Financial applications frequently need to present several related market metrics within the same chart. For example, a chart may combine stock prices with traded volume, technical indicators, market benchmarks, or comparative securities.
NOV Chart can easily visualize such charts as it supports multiple chart series, axes, and chart panels. In addition, chart axes can be synchronized so you can plot data on several plots that share the same x-axis, a feature that is commonly used to display stock with volume and indicator data.
This makes it possible to build advanced financial charts that present different market information in a single view.
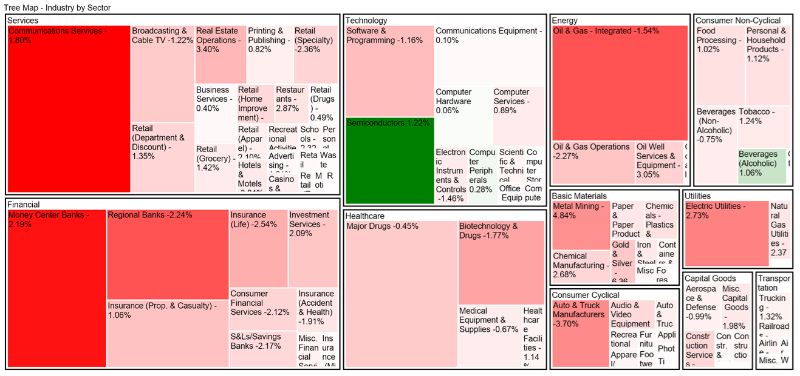
NOV Chart also supports less common financial charts such as financial treemaps that provide a compact overview of markets, portfolios, sectors, or asset classes. The size and color of each treemap cell can represent values such as market capitalization, portfolio weight, price performance, or trading activity. This helps investors quickly evaluate market composition, sector exposure, relative performance, and asset allocation.
The size and color of each treemap cell can represent values such as market capitalization, portfolio weight, price performance, or trading activity. This helps investors quickly evaluate market composition, sector exposure, relative performance and asset allocation.
Technical indicators are mathematical calculations based on price, volume, and other market data. They help traders analyze market direction, momentum, volatility, and the strength of price movements.
NOV Chart supports displaying technical indicators directly over stock-price data or in synchronized chart panels below the main price chart.
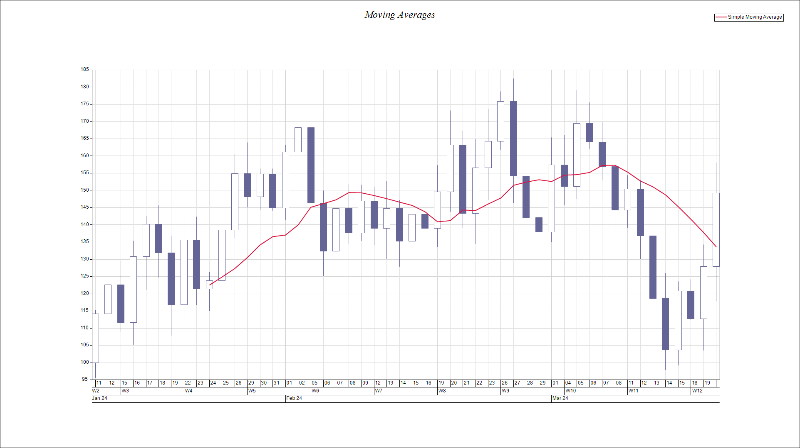
Moving averages smooth short-term price fluctuations and make the underlying market direction easier to identify.
NOV Chart supports commonly used moving averages such as the Simple Moving Average (SMA) and Exponential Moving Average (EMA). Moving averages can be combined with stock-price series to identify trends, crossovers and potential changes in market direction.
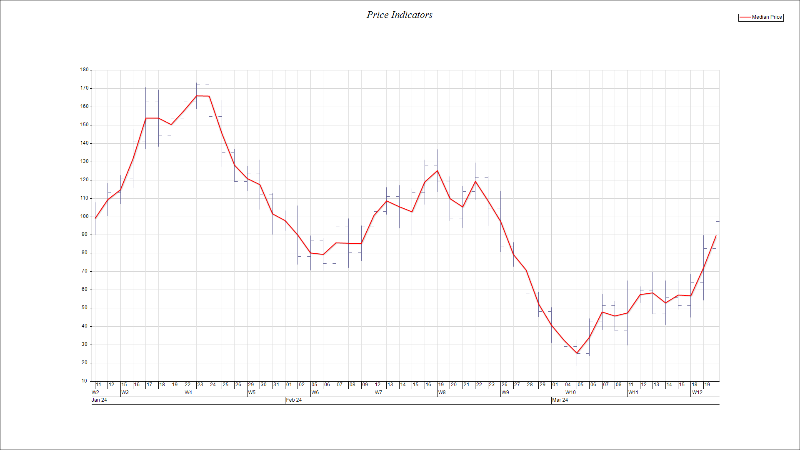
Price indicators calculate a representative value for each trading period using combinations of its open, high, low and closing prices.
Among the indicators supported by NOV Chart are Median Price, Typical Price, Weighted Close and Average Price.
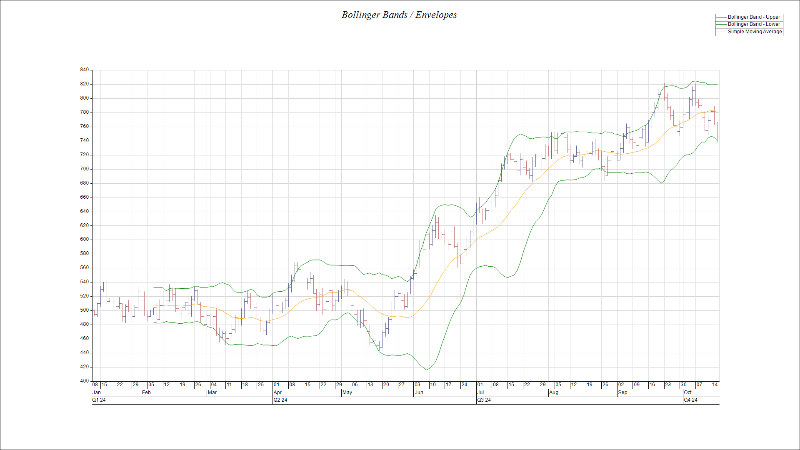
NOV Chart also supports range and volatility indicators. Those indicators display upper and lower boundaries around market prices. Examples include Bollinger Bands, Moving Average Envelopes, and price channels.
These indicators help traders evaluate volatility, identify expanding or contracting trading ranges, and recognize potential breakouts.
Volume indicators analyze trading activity to evaluate the strength behind price movements.
NOV Chart supports volume indicators such as On-Balance Volume, Chaikin Money Flow, and Volume Oscillator that can help confirm trends, reveal buying or selling pressure, or identify potential reversals or breakouts.
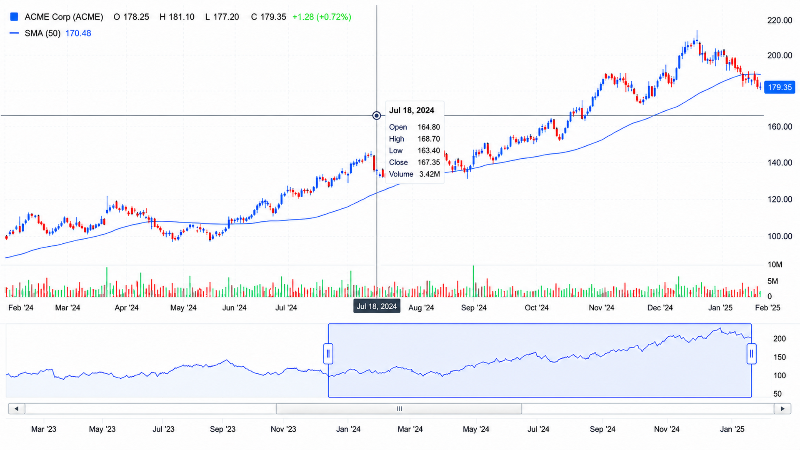
NOV Chart provides interactive tools for exploring large financial datasets. Users can zoom into selected time periods and scroll through data with smooth, responsive interaction.
Interactivity features are complemented with interactive cursors and tooltips that allow users to inspect individual price points. Developers can extend the functionlaity if the control with custom application specific one by using the hit testing feature that allows them to inspect the chart element at the current mouse position
Further, zooming and scrolling features can be synchronized with other chart panels, which makes it easier to analyze the same period across different metrics such as price, volume, and indicator data.
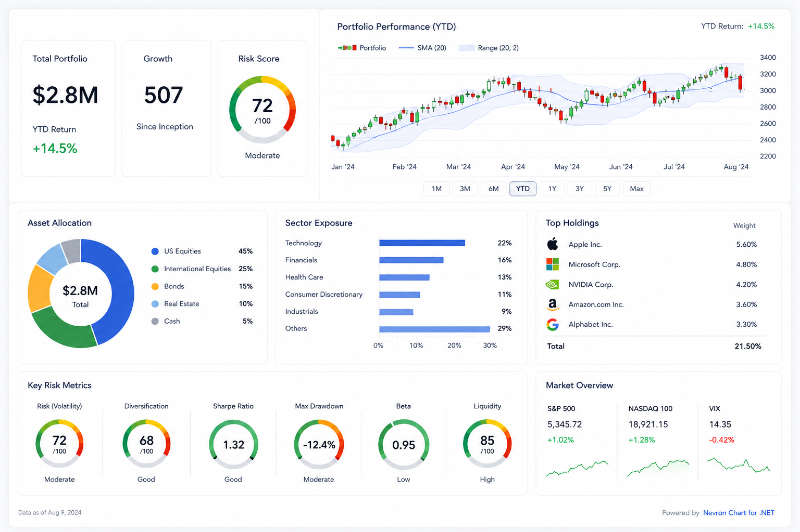
NOV Chart can be used together with NOV Rich Text Editor to create programmatic financial reports containing data, charts, and KPIs. It enables you to create visualizations for portfolio growth, asset performance, returns, and comparative analysis.
Because NOV Chart can run on any .NET Core server, it is also well suited for automated report generation with rich charting content. Reports can be generated and deployed on AWS, Azure, Docker, or any other ASP.NET Core-compatible environment.
can be exported to all common text document formats, including PDF, DOCX, RTF, and HTML.
The control allows you to create complex financial charts by combining multiple data series in a single visualization. You can display price data, volume, analytical values, and comparison data.
The chart can display different financial measurements together using multiple axes with independent ranges and units. The ability to customize axis labels, tick marks, grid lines, formatting, and scale behavior gives you precise control over the content of the financial data presented to the user.
The built-in GPU acceleration and multithreading support ensure you can visualize large amounts of historical financial data while maintaining smooth performance.
The interactivity features of the controls allow users to analyze financial information using built-in zooming, scrolling, tooltips, and hit testing. This makes it easy for users to navigate large datasets and inspect individual data points.
You can choose from the common charting types found in business applications such as Line, Bar, Area, Point, etc and mix them with specialized financial charts like OHLC, Candlestick, Kagi, Renko, Three Line Break, and Treemaps.
Build financial charting applications across multiple .NET platforms using a consistent development model. NOV Chart supports desktop and web environments including WPF, WinForms, Blazor WebAssembly, and macOS applications.
NOV Chart is integrated into many enterprise financial visualizations applications, reporting systems, analytics platforms, and custom enterprise software solutions built with .NET.


