
ProductsAll Products
.NET Components
 Open Vision for .NET
 NOV Chart for .NET
 NOV Diagram for .NET
 NOV Rich Text Editor for .NET
 NOV Grid for .NET
 NOV Schedule for .NET
 NOV Gauge for .NET
 NOV Barcode for .NET
 NOV User Interface for .NET
 Vision for .NET
 Chart for .NET
 Diagram for .NET
 User Interface for .NET
 Vision for SSRS
 Chart for SSRS
 Gauge for SSRS
 Map for SSRS
 Barcode for SSRS
 Vision for SharePoint
 Chart for SharePoint
 Gauge for SharePoint
 Map for SharePoint
 Barcode for SharePoint
DownloadsAll Downloads
NOV Chart for .NET is a powerful charting framework for creating high-performance scientific, engineering, medical, and technical data-visualization applications with C# and .NET. Its GPU-accelerated rendering engine, specialized Fast Series, advanced 2D and 3D chart types, and flexible axes make it possible to visualize and analyze datasets containing millions of data points.
Developers can use NOV Chart to build scientific dashboards, engineering analysis tools, real-time monitoring systems, simulation applications, laboratory software, and automated technical reports for WinForms, WPF, Blazor, and macOS from a single code base.
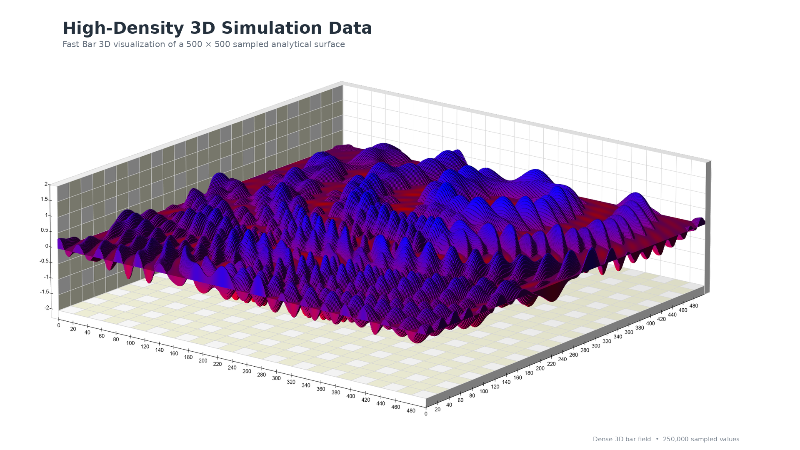
Scientific and engineering applications frequently need to display large volumes of continuously changing data. Conventional charting components often struggle when processing millions of values or updating complex visualizations in real time.
NOV Chart addresses this challenge with a specialized set of Fast Series, including Fast Line, Fast Point, Fast Bar, Fast Area, Fast Surface, and others. These series extensively use GPU acceleration to perform many of the calculations required for rendering on the GPU, thus allowing applications to visualize millions of data points while maintaining smooth and responsive performance.
All Fast Series in NOV Chart store data in memory in interleaved format, which is optimal for direct rendering on the GPU, because all vertex information is stored together, resulting in excellent locality. Further, all Fast Series support two rendering modes. The first rendering mode relies on the fixed OpenGL pipeline, and the second one uses GLSL shaders. The fixed pipeline model is better suited for static data as additional vertex information such as face normals is computed once and then rendered many times by the GPU. The second model is better suited for continuously changing data as all additional vertex information and primitive assembly is performed entirely by the GPU.
Fast Series support both 2D and 3D visualization and can display individual colors for each data point, which optionally adds another dimension to the visualized data set. All Fast Series also support coloring using a developer-specified gradient palette.
All those features make them suitable for demanding applications such as signal processing, sensor monitoring, medical diagnostics, telemetry analysis, process control, metrology, and scientific simulations.
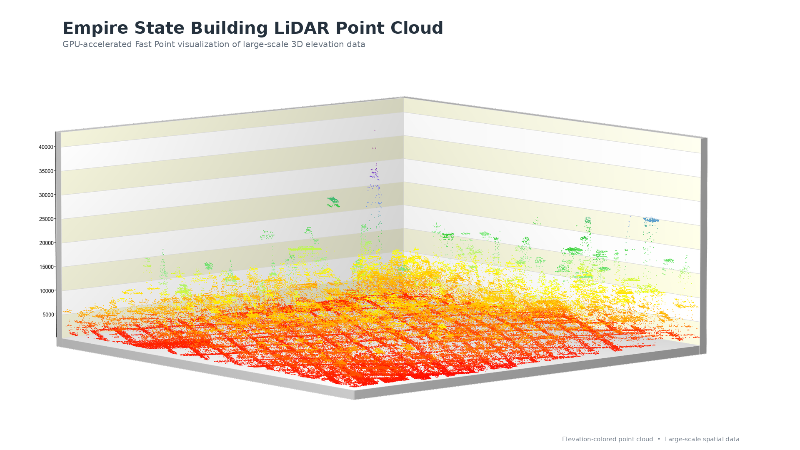
XY and XYZ Scatter Plots represent the relationship between two or three numerical variables using independent X, Y, and Z coordinates. They are widely used to visualize point clouds, experimental observations, mathematical functions, and others.
NOV Chart supports XY and XYZ variations for the Point, Line, Bar, Error Bar, Bubble, and Range series. The Fast Series variation of those series also supports direct import for LiDAR point clouds.
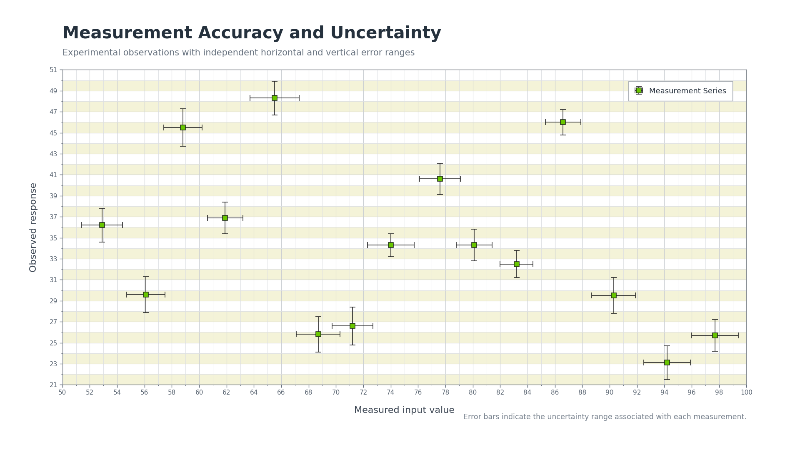
Other charts that are commonly used in scientific and engineering measurements are Error Bar charts. They can display uncertainty, tolerance, standard deviation, confidence intervals, or expected variation around measured and calculated values and are also fully supported by the control.
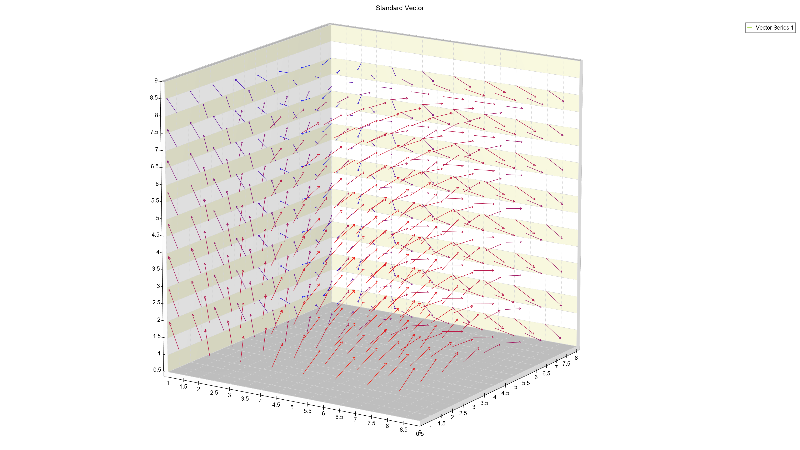
Vector charts represent quantities that have both magnitude and direction. Each vector is defined by a starting point and an ending point and is displayed as a directional arrow.
They can be used to visualize velocity, force, acceleration, displacement, magnetic fields, fluid flow, wind direction, and other directional measurements. NOV Chart supports Vector charts in 2D and 3D Cartesian coordinate systems, as well as Polar Vector charts.
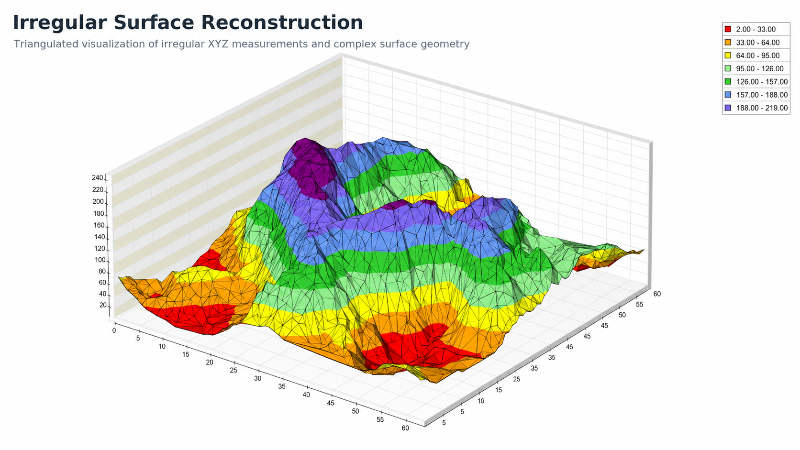
Surface charts are one of the most widely used charting series in scientific charting. They are commonly used to visualize mathematical functions, terrains, surface temperatures, and others.
NOV Chart supports several specialized Surface Series:
In NOV Chart, all surface series are implemented as Fast Series so they share the same benefits like GPU friendly memory optimized storage and GLSL rendering support.
We also take great pride in the quality and speed of our triangulator, which can perform triangulation on millions of data points in real time.
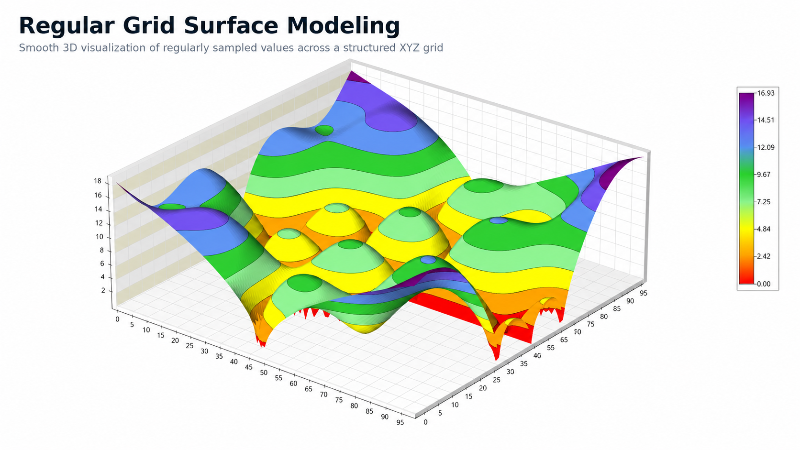
Surface colors can be mapped to numerical values, making differences in elevation, temperature, pressure, intensity, or other measurements easier to identify.
NOV Chart supports uniform filling, palette-based elevation zones, and individual vertex colors. Surface frames can display mesh lines, contour lines, data-point positions, or a combination of mesh and contour lines.
Flat and smooth shading modes allow developers to choose between a uniform or interpolated normal per vertex triangle, resulting in faceted vs smooth appearance when lighting is applied.
Surface data can also be projected onto a fixed elevation to create flat-contour visualizations.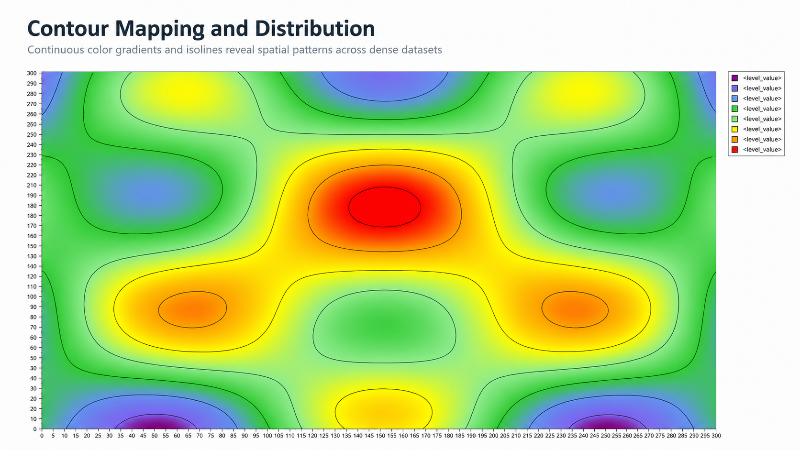
Heatmaps provide a two-dimensional representation of matrix-based data. Each value is mapped to a color from an associated palette, allowing users to identify patterns, concentrations, gradients, boundaries, and anomalies.
Heatmaps are commonly used for thermal analysis, signal intensity, correlation matrices, density distributions, spectrograms, medical imaging, and simulation results.
NOV Chart supports Heatmaps in both 2D and 3D (using the Grid Surface Draw Flat option). Both Heat Maps and Surface chart series support automatic construction, visualization and annotation of contour lines.
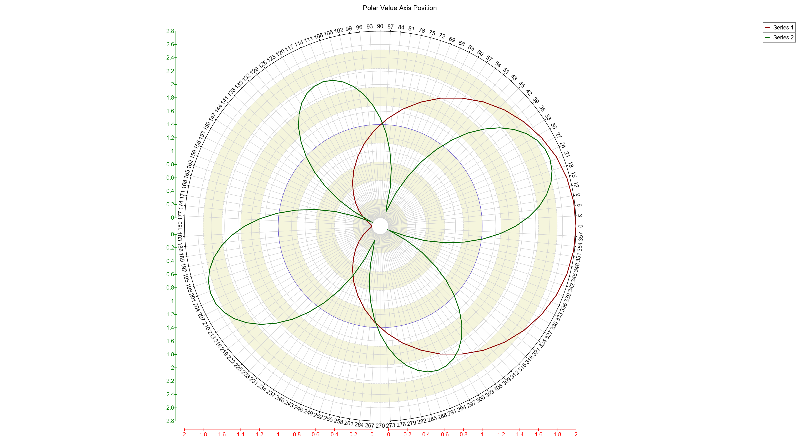
Scientific and engineering charts often combine measurements expressed in different units or operating across different ranges, which requires scientific charts to support multiple axes. NOV Chart supports multiple X, Y, and Z axes that can be docked, crossed, or configured to share different parts of the same plot.
Each axis has an associated scale, and the control supports all common scales found in scientific charts, including linear, logarithmic, date-time, ordinal, timeline, and hierarchical scales. Axes can be docked to the plot area or positioned so that they cross another axis at a specified value.
In addition, all scales support many features typically used in scientific charts, such as:
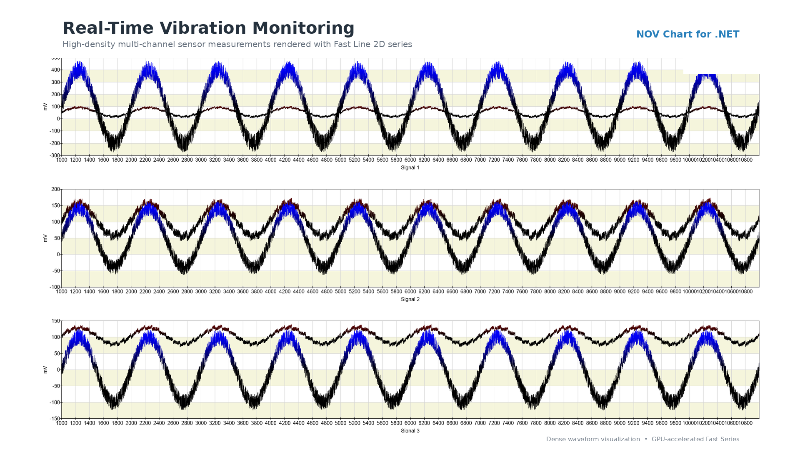
Scientific instruments, industrial systems, and monitoring devices often generate streams of measurements that are best plotted and comprehended on multiple chart plots. A very common example is signal processing tools where different signals are plotted side by side. NOV Chart can display multiple chart plots in 2D and 3D in real time. In addition chart plots can be mixed with other technical content such as Gauges, Knobs, Tables, and other Instrumentation Widgets. This allows users to create responsive monitoring dashboards that combine raw measurements, calculated values, controls, and system schematics together in one view.
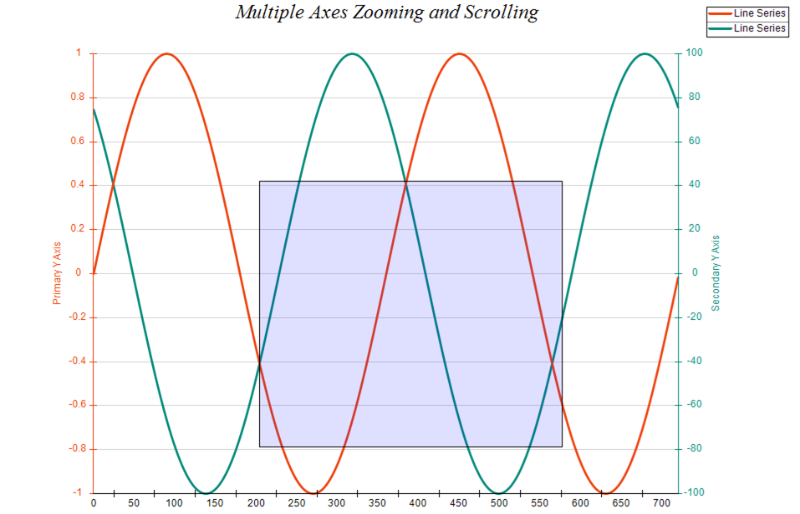
NOV Chart provides built-in tools for exploring large datasets. Users can zoom in on regions of interest, pan across the chart, and scroll through data using axis scrollbars. Mouse-wheel zooming can focus on the current pointer position, making it easier to examine a specific region.
Additional features include interactive cursors, tooltips, and hit testing. They allow users to inspect individual measurements as well as to implement custom logic in response to user inputs.
Users can also rotate and inspect 3D charts from different viewing angles to reveal spatial relationships, overlapping structures, surface features, and data clusters that may not be visible from a fixed point of view.
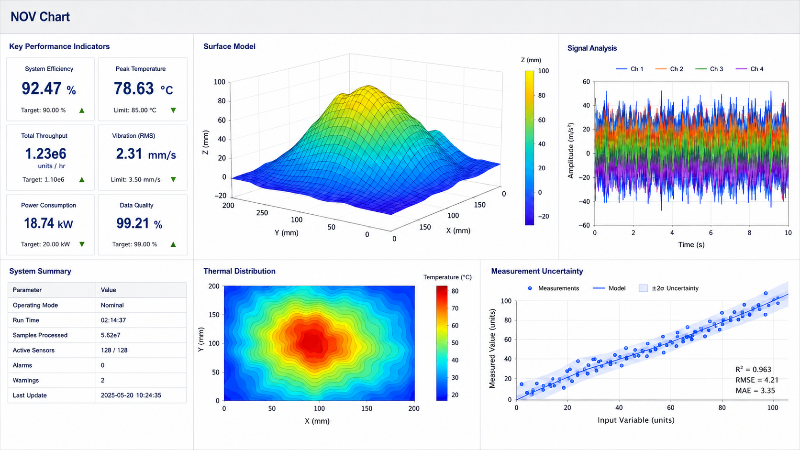
NOV Chart can be used to build scientific dashboards for real-time monitoring, signal analysis, engineering simulation, medical diagnostics, laboratory research, and industrial process control.
Dashboards can combine multiple synchronized charts with data grids, gauges, labels, and other widgets. This allows developers to implement dashboards that monitor live measurements and analyze large datasets.
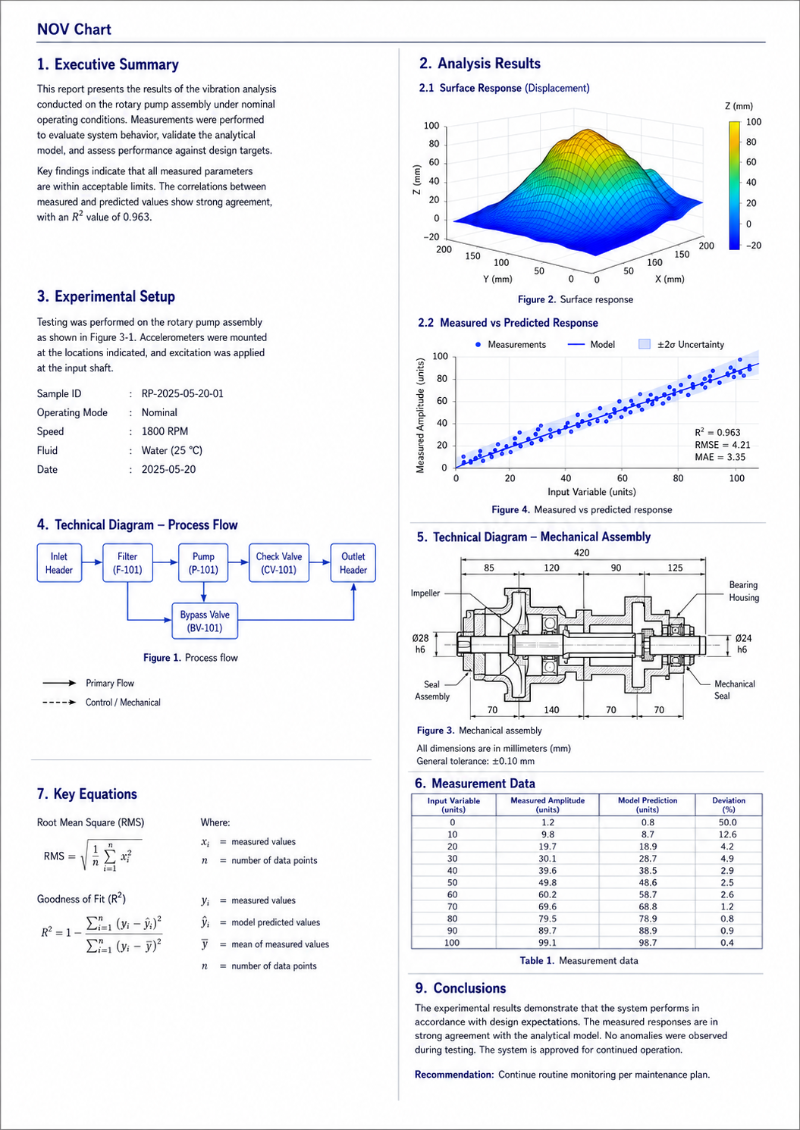
NOV Chart can be used along-side with NOV Diagram, NOV Rich Text Editor, and the other controls in the suite to generate programmatic reports containing scientific data, charts, tables, formulas, and schematics.
Because NOV Chart and the rest of the controls in the suite can operate on any .NET Core server, it is well suited for automated report generation on AWS, Azure, Docker, and other ASP.NET Core-compatible environments.
Reports can be exported to raster and vector formats, including PNG, JPEG, SVG, and PDF, for use in presentations, technical publications, and high-resolution printing.
GPU-accelerated Fast Series enable applications to visualize millions of data points in realtime.
Use XY and XYZ Scatter Plots, Heatmaps, Vector charts, Error Bars, and Surface Chart types to plot scientific and engineering data.
Choose from Grid, Mesh, Triangulated, and Vertex Surface charts according to the structure of the source data.
Configure multiple X, Y, and Z axes using linear, logarithmic, date-time, timespan, ordinal, timeline, and hierarchical scales.
Enable users to explore datasets through zooming, panning, scrolling, crosshair cursors, tooltips, hit testing, and interactive 3D rotation.
Build performant, GPU accelerated monitoring and analysis applications for continuously changing data.
Export scientific visualizations to raster and vector formats or combine NOV Chart with NOV Rich Text Editor to generate automated technical reports.
Create scientific and engineering charting applications for WPF, WinForms, Blazor, and macOS using a consistent API and a single C# codebase.
NOV Chart is integrated into many enterprise applications across scientific fields, such as laboratory software, metrology, simulation, and monitoring systems.


