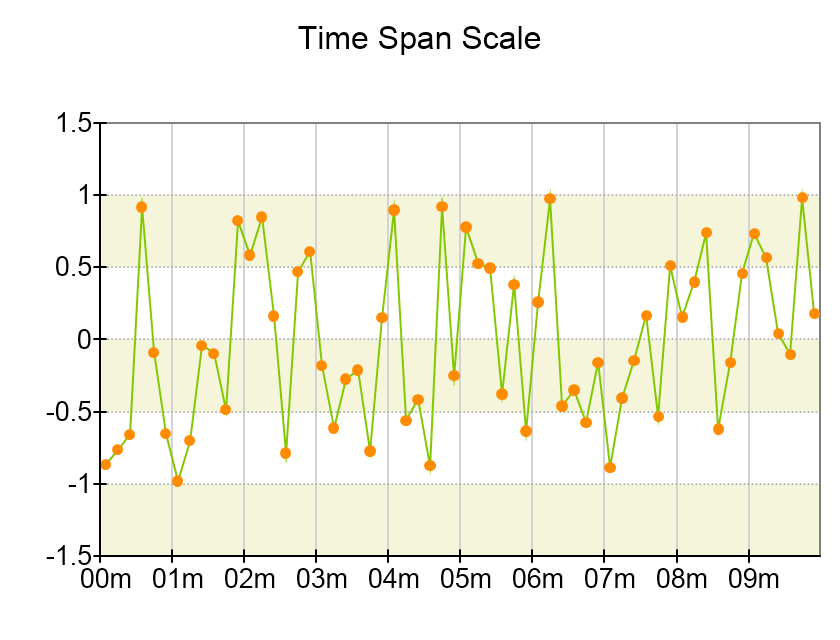
The TimeSpan Scale is used when you need to display time durations that are not linked to specific dates, or when date information is not relevant to the data being plotted. Examples of such data involve all cases where the X or Y values correspond to durations, intervals, or elapsed time rather than absolute dates. The TimeSpan Scale only uses time units when generating scale ticks and labels. Time units include Tick, Millisecond, Second, Minute, Hour, Half Day, Day, and Week units.

 Open Vision for .NET
 NOV Chart for .NET
 NOV Diagram for .NET
 NOV Rich Text Editor for .NET
 NOV Grid for .NET
 NOV Schedule for .NET
 NOV Gauge for .NET
 NOV Barcode for .NET
 NOV User Interface for .NET
 Vision for .NET
 Chart for .NET
 Diagram for .NET
 User Interface for .NET
 Vision for SSRS
 Chart for SSRS
 Gauge for SSRS
 Map for SSRS
 Barcode for SSRS
 Vision for SharePoint
 Chart for SharePoint
 Gauge for SharePoint
 Map for SharePoint
 Barcode for SharePoint