|
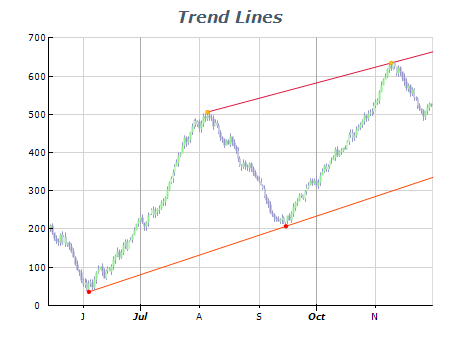
 | Line Studies are lines and various geometric figures that are plotted in price charts or in indicator charts. They are used as analytical instruments helping to define channels, support and resistance levels and trend changes and to forecast price dynamics. The trendline is a straight line that connects two price points and depicts the general direction in which a security is headed. It extends into the future to act as a line of support or resistance. |
|
|
Fibonacci arcs are created by drawing an invisible trendline between two points, and then drawing three curves that intersect this trendline at the key Fibonacci levels of 38.2, 50 and 61.8%. Fibonacci Arcs are considered to represent potential support and resistance levels. Fibonacci Arcs and Fibonacci Fans are usually plotted together on the chart. Support and resistance levels are determined by the points of intersection of these lines. |  |
|
|
 | A trend line is drawn between two extreme points. Then an invisible vertical line is drawn through the second extreme point. Three trend lines are drawn from the first extreme point, so that they intersect the invisible vertical line at Fibonacci levels of 38.2, 50, and 61.8%. These lines are considered to represent support and resistance levels. For getting a more precise forecast, it is recommended to use other Fibonacci instruments along with the Fan. |
|
|
Fibonacci Retracements are nine horizontal lines intersecting the trend line between two points at Fibonacci levels of 0.06, 38.2, 50, 61.8, 100, 161.88, and 423.6%. After a significant change, prices often return to their previous levels correcting an essential part of their initial movement. Prices often face support/resistance at the level of Fibonacci Retracements or near them in the course of such a movement. |  |
|
|
 | Quadrant Lines are a series of horizontal lines that divide the space between highest and lowest values into four equal sections. They are primarily intended to aid in the visual inspection of price movements. |
|
|
Speed Resistance Lines (also called 1/3 - 2/3 lines) are a series of trendlines that divide a price move into three equal sections. They are similar in construction and interpretation to Fibonacci Fans. |  |
|
|