Nevron Logo

.NET Chart Price Indicators

Price Indicators

Price indicators are essential in technical analysis to help traders and investors make informed decisions in the financial markets. One such indicator is the Typical Price, an average of each day's price. Investors often use the Typical Price instead of the closing price when creating moving average penetration systems. Another popular price indicator is the Weighted Close, which is an average of each day's price. As the name suggests, the closing price is given extra weight, giving investors a more accurate picture of market trends. The Median Price indicator is another valuable tool for investors wanting a simpler price view. It calculates the midpoint of each day's price, providing investors with an average price that is easy to interpret. Price indicators like these are commonly used in technical analysis to identify potential buy and sell signals, track the progress of a security over time, and make informed investment decisions.

Median Price

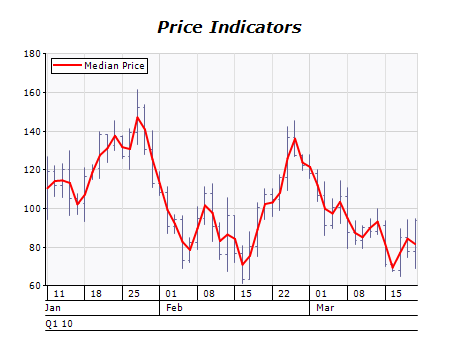
The median price is a popular indicator used in technical analysis to help traders and investors get a simplified view of market prices. This indicator calculates the midpoint of each day's price, providing a beneficial average price that is easy to interpret. Unlike other price indicators that rely on the open, high, low, or closing price, the Median Price gives equal weight to all daily prices. This can help investors avoid biases from using other indicators that rely too heavily on a particular price point.

Using the Median Price indicator, traders and investors can get a complete picture of market trends and make informed decisions. By providing a simplified view of market prices, the Median Price can help investors identify potential buy and sell signals, track the progress of a security over time, and make profitable investment decisions.

Typical Price

The Typical Price indicator is widely used in technical analysis that helps investors better understand market trends. This indicator calculates the average security price for a given day by adding the high, low, and closing prices and dividing them by three. This results in a more comprehensive view of market trends, considering the full range of daily prices. Using the Typical Price indicator, investors can better identify potential buy and sell signals in the market and make more informed decisions about when to enter or exit a position. By incorporating the Typical Price into their technical analysis, investors can develop a more nuanced understanding of market trends and take advantage of opportunities.

Weighted Close

The Weighted Close indicator is a valuable tool for traders and investors, providing a simple yet effective way to track an asset's average price over time. This indicator emphasizes the closing price, which many traders consider a key price point. Additionally, the Weighted close chart offers a clearer picture of an asset's price movements by including the high and low prices and the closing price. By using this indicator, traders can better understand an asset's price trends and make more informed trading decisions.