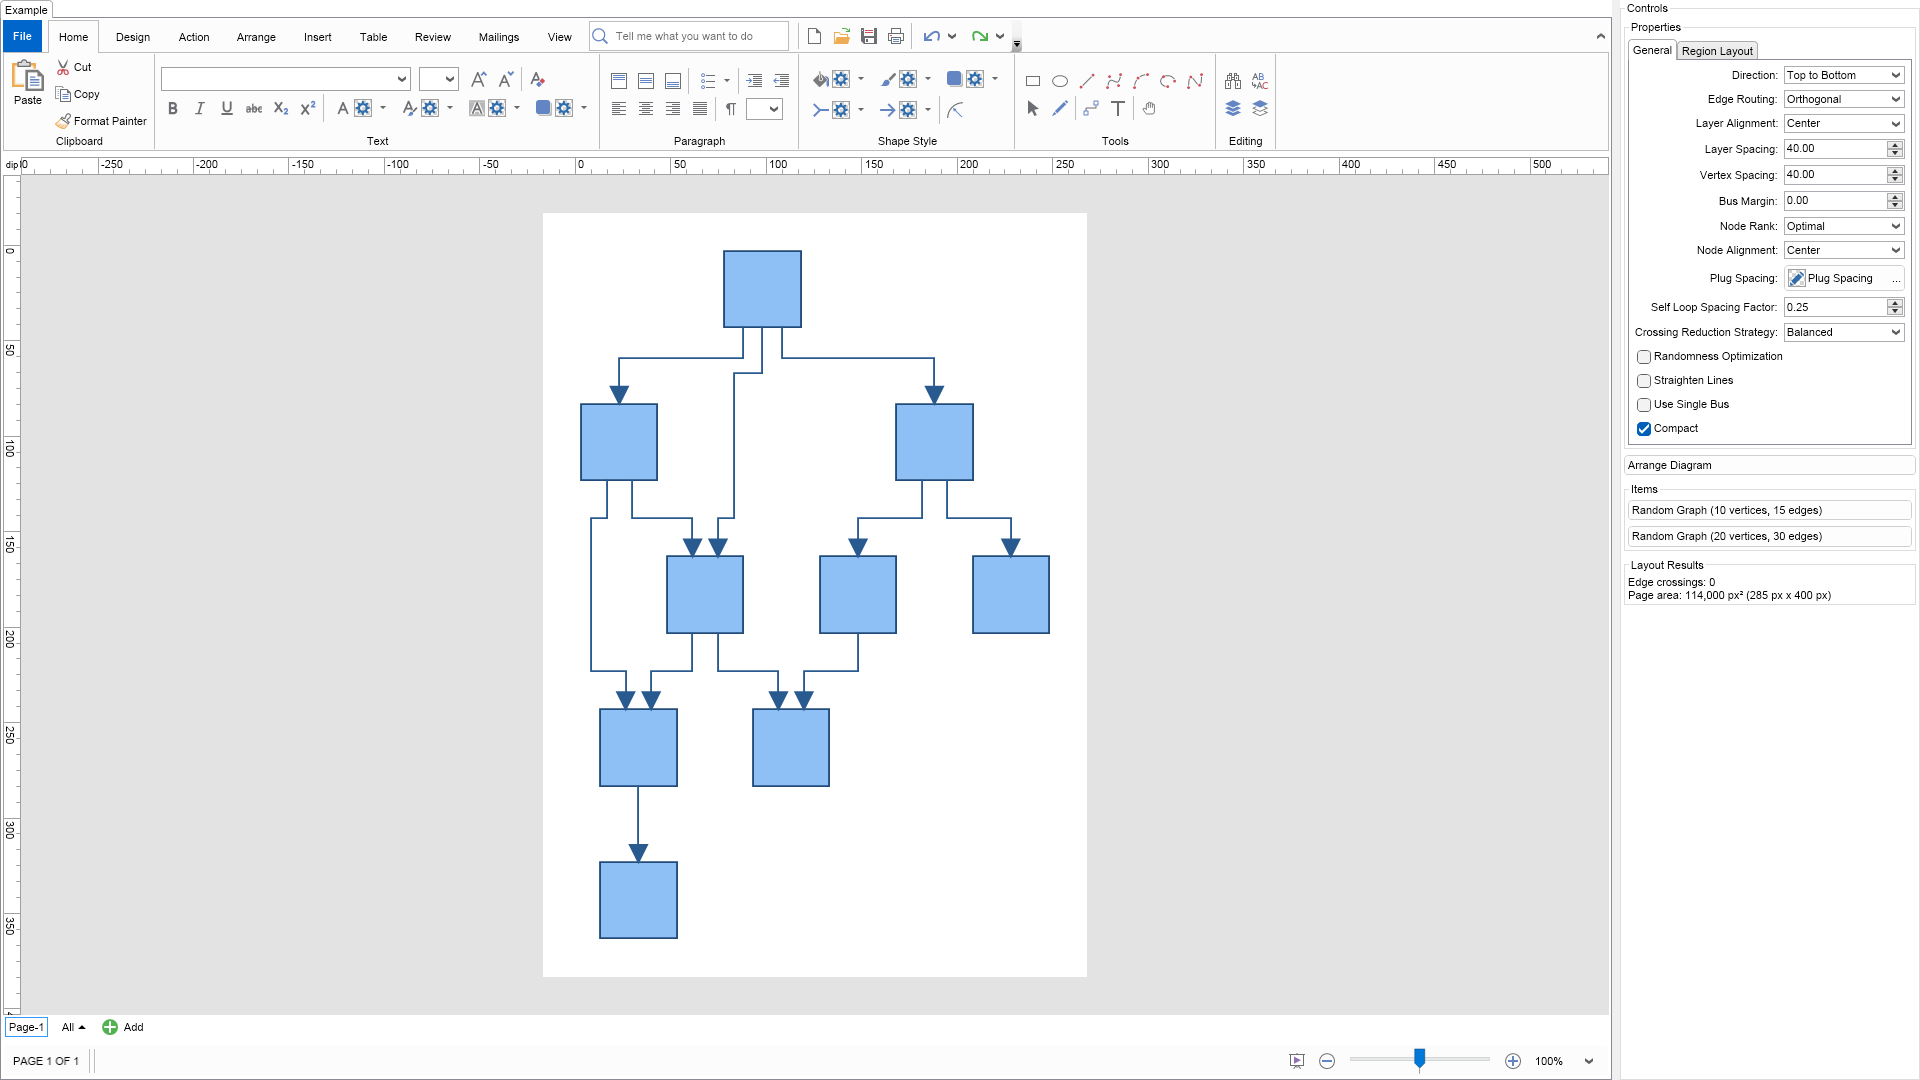
Imports Nevron.Nov
Imports Nevron.Nov.Diagram
Imports Nevron.Nov.Diagram.Layout
Imports Nevron.Nov.Diagram.Shapes
Imports Nevron.Nov.Dom
Imports Nevron.Nov.Editors
Imports Nevron.Nov.Graphics
Imports Nevron.Nov.Layout
Imports Nevron.Nov.UI
Imports Nevron.Nov.Windows.Forms
Imports System
Public Class Form1
#Region "Constructors"
Public Sub New()
' This call is required by the designer.
InitializeComponent()
' Add any initialization after the InitializeComponent() call.
' Set form title
Text = "NOV WinForms - NLayeredGraphLayoutExample"
' Create the NOV example and its controls
Dim exampleContent As NWidget = CreateExampleContent()
Dim exampleControls As NWidget = CreateExampleControls()
If Not exampleControls Is Nothing Then
exampleControls.PreferredWidth = 300
End If
' Place the example and its controls in a pair box
Dim pairBox As NPairBox = New NPairBox(exampleContent, exampleControls)
pairBox.FillMode = ENStackFillMode.First
pairBox.FitMode = ENStackFitMode.First
pairBox.Margins = New NMargins(NDesign.HorizontalSpacing, NDesign.VerticalSpacing)
' Host the example in the form
Dim host As NNovWidgetHost(Of NWidget) = New NNovWidgetHost(Of NWidget)(pairBox)
host.Dock = DockStyle.Fill
Controls.Add(host)
End Sub
#End Region
#Region "Example"
Public Function CreateExampleContent() As NWidget
' Create a simple drawing
Dim drawingViewWithRibbon As NDrawingViewWithRibbon = New NDrawingViewWithRibbon()
m_DrawingView = drawingViewWithRibbon.View
m_DrawingView.Document.HistoryService.Pause()
Try
InitDiagram(m_DrawingView.Document)
Finally
m_DrawingView.Document.HistoryService.Resume()
End Try
Return drawingViewWithRibbon
End Function
Public Function CreateExampleControls() As NWidget
Me.m_Layout.Changed += AddressOf OnLayoutChanged
Dim stack As NStackPanel = New NStackPanel()
' property editor
Dim editor As NEditor = NDesigner.GetDesigner(m_Layout).CreateStandaloneEditor(m_Layout)
stack.Add(New NGroupBox("Properties", editor))
Dim arrangeButton As NButton = New NButton("Arrange Diagram")
arrangeButton.Click += AddressOf OnArrangeButtonClick
stack.Add(arrangeButton)
' items stack
Dim itemsStack As NStackPanel = New NStackPanel()
' NOTE: For Graph layouts we provide the user with the ability to generate random graph diagrams so that he/she can test the layouts
Dim randomGraph1Button As NButton = New NButton("Random Graph (10 vertices, 15 edges)")
randomGraph1Button.Click += AddressOf OnRandomGraph1ButtonClick
itemsStack.Add(randomGraph1Button)
Dim randomGraph2Button As NButton = New NButton("Random Graph (20 vertices, 30 edges)")
randomGraph2Button.Click += AddressOf OnRandomGraph2ButtonClick
itemsStack.Add(randomGraph2Button)
stack.Add(New NGroupBox("Items", itemsStack))
' Create the layout result label
m_ResultLabel = New NLabel()
stack.Add(New NGroupBox("Layout Results", m_ResultLabel))
UpdateResultLabel()
Return stack
End Function
Public Function GetExampleDescription() As String
Return "
The layered graph layout is used to layout a graph in layers.
The layout strives to minimize the number of crossings between edges
and produces a polyline graph drawing. This type of layout is very useful
for the arrangement of flow diagrams, since it works well on all types of graphs
(including those with self-loops and duplicate edges).
The most important properties are:
-
Direction - determines the flow direction of the layout. By default set to TopToBottom.
-
EdgeRouting - determines what edge routing is applied. Possible values are:
- Polyline - the edges are drawn using a polyline with few bends
- Orthogonal - the edges are drawn using only horizontal and vertical line segments
-
NodeRank - specifies the node ranking policy used by the layout. It can be:
- TopMost - all nodes without incoming edges are assigned to the topmost layer
- Gravity - layer distribution is done in such a way that the total length of all edges is minimized
- Optimal - similar to the topmost, but after the initial assignment all nodes fall downwards as much as possible
-
PlugSpacing - determines the spacing between the plugs of a node.
You can set a fixed amount of spacing or a proportional spacing, which means that the plugs
are distributed along the whole side of the node.
-
LayerAlignment - determines the vertical alignment of the nodes in the layers.
-
NodeAlignment - determines the horizontal alignment of the nodes in the layers.
-
SelfLoopSpacingFactor - determines the self-loop spacing factor. It spaces the self-loops as a ratio of the body height.
-
VertexSpacing and LayerSpacing - determine the spacing between nodes and layers
respectively.
-
StraightenLines - if turned on an additional step is performed that tries to
straighten the lines as much as possible in the case of orthogonal edge routing.
-
UseSingleBus - if true and the EdgeRouting is orthogonal, all edges will be
placed on a single bus between each pair of layers.
-
Compact - determines whether the layout should try to minimize the width of the drawing or not.
You can set the index of a given node in its layer explicitly using the IndexInLayer property
from the LayoutData collection of the node. By default the index is set to -1 which
means that the layout will automatically calculate it. If you set a value greater than or equal
to 0 the node will be placed at that index. If the index is greater than the total number
of nodes in the layer, it will be set equal to the number of vertices - 1.
To experiment with the layout just change its properties from the property grid and click the Layout button.
To see the layout in action on a different graph, just click the Random Graph button.
"
End Function
'''
''' Gets the relevant documentation links for the example
'''
'''
Public Function GetDocumentationUrls() As (String, String)()
Return {("Layered Graph Layout", "https://www.nevron.com/docs/openvision/diagram-layered-graph-layout.html"), ("Layouts Overview", "https://www.nevron.com/docs/openvision/diagram-drawing-layouts-overview.html"), ("Graph Regions and Regions Layouts", "https://www.nevron.com/docs/openvision/diagram-graph-regions-and-region-layouts.html"), ("Shape Navigation", "https://www.nevron.com/docs/openvision/diagram-shape-navigation.html")}
End Function
Private Sub InitDiagram(drawingDocument As NDrawingDocument)
Const width As Double = 40
Const height As Double = 40
Const distance As Double = 80
' Hide ports
drawingDocument.Content.ScreenVisibility.ShowPorts = False
Dim basicShapes As NBasicShapeFactory = New NBasicShapeFactory()
Dim activePage = drawingDocument.Content.ActivePage
Dim from = New Integer() {1, 1, 1, 2, 2, 3, 3, 4, 4, 5, 6}
Dim [to] = New Integer() {2, 3, 4, 4, 5, 6, 7, 5, 9, 8, 9}
Dim shapes = New NShape(8) {}
Dim vertexCount = shapes.Length, edgeCount = from.Length
Dim i, j As Integer, count = vertexCount + edgeCount
For i = 0 To count - 1
If i < vertexCount Then
j = If(vertexCount Mod 2 = 0, i, i + 1)
shapes(i) = basicShapes.CreateShape(ENBasicShape.Rectangle)
If vertexCount Mod 2 <> 0 AndAlso i = 0 Then
shapes(CInt(i)).SetBounds(New NRectangle((width + distance * 1.5) / 2, distance + j / 2 * (distance * 1.5), width, height))
Else
shapes(CInt(i)).SetBounds(New NRectangle(width / 2 + (j Mod 2) * (distance * 1.5), height + j / 2 * (distance * 1.5), width, height))
End If
activePage.Items.Add(shapes(i))
Else
Dim edge As NRoutableConnector = New NRoutableConnector()
edge.UserClass = NDR.StyleSheetNameConnectors
activePage.Items.Add(edge)
edge.GlueBeginToShape(shapes(from(i - vertexCount) - 1))
edge.GlueEndToShape(shapes([to](i - vertexCount) - 1))
End If
Next
' arrange diagram
ArrangeDiagram(drawingDocument)
' fit active page
drawingDocument.Content.ActivePage.ZoomMode = ENZoomMode.Fit
End Sub
#End Region
#Region "Implementation"
'''
''' Arranges the shapes in the active page.
'''
'''
Private Sub ArrangeDiagram(drawingDocument As NDrawingDocument)
' get all top-level shapes that reside in the active page
Dim activePage = drawingDocument.Content.ActivePage
Dim shapes = activePage.GetShapes(False)
' create a layout context and use it to arrange the shapes using the current layout
Dim layoutContext As NDrawingLayoutContext = New NDrawingLayoutContext(drawingDocument, activePage)
m_Layout.Arrange(shapes.CastAll(Of Object)(), layoutContext)
' size the page to the content size
activePage.SizeToContent()
' update the result label
UpdateResultLabel()
End Sub
Private Sub UpdateResultLabel()
If m_ResultLabel Is Nothing Then Return
Dim page = m_DrawingView.ActivePage
Dim crossings = NLayoutHelpers.GetNumberOfEdgeCrossings(page)
m_ResultLabel.Text = $"Edge crossings: {crossings}" & Environment.NewLine & $"Page area: {page.Width * page.Height:N0} px² ({page.Width:N0} px x {page.Height:N0} px)"
End Sub
#End Region
#Region "Event Handlers"
Private Sub OnRandomGraph1ButtonClick(arg As NEventArgs)
Dim drawingDocument = m_DrawingView.Document
drawingDocument.StartHistoryTransaction("Create Random Graph 1")
Try
m_DrawingView.ActivePage.Items.Clear()
' create a random graph
Dim graph As NRandomGraphTemplate = New NRandomGraphTemplate()
graph.EdgeUserClass = NDR.StyleSheetNameConnectors
graph.VertexCount = 10
graph.EdgeCount = 15
graph.VertexShape = VertexShape
graph.VertexSize = VertexSize
graph.Create(drawingDocument)
' arrange the graph
ArrangeDiagram(drawingDocument)
Finally
drawingDocument.CommitHistoryTransaction()
End Try
End Sub
Private Sub OnRandomGraph2ButtonClick(arg As NEventArgs)
Dim drawingDocument = m_DrawingView.Document
drawingDocument.StartHistoryTransaction("Create Random Graph 2")
Try
m_DrawingView.ActivePage.Items.Clear()
' create a test graph
Dim graph As NRandomGraphTemplate = New NRandomGraphTemplate()
graph.EdgeUserClass = NDR.StyleSheetNameConnectors
graph.VertexCount = 20
graph.EdgeCount = 30
graph.VertexShape = VertexShape
graph.VertexSize = VertexSize
graph.Create(drawingDocument)
' layout the graph
ArrangeDiagram(drawingDocument)
Finally
drawingDocument.CommitHistoryTransaction()
End Try
End Sub
Private Sub OnLayoutChanged(arg As NEventArgs)
ArrangeDiagram(m_DrawingView.Document)
m_DrawingView.Content.ScreenVisibility.ShowPorts = False
End Sub
Private Sub OnArrangeButtonClick(arg As NEventArgs)
ArrangeDiagram(m_DrawingView.Document)
End Sub
#End Region
#Region "Fields"
Private m_DrawingView As NDrawingView
Private m_ResultLabel As NLabel
Private m_Layout As NLayeredGraphLayout = New NLayeredGraphLayout()
#End Region
#Region "Static Methods"
#End Region
#Region "Constants"
Private Const VertexShape As ENBasicShape = ENBasicShape.Rectangle
Private Shared ReadOnly VertexSize As NSize = New NSize(50, 50)
#End Region
#Region "Nested Types"
#End Region
End Class

 Chart for .NET
 Diagram for .NET
 User Interface for .NET
 Vision for SSRS
 Chart for SSRS
 Gauge for SSRS
 Map for SSRS
 Barcode for SSRS
 Vision for SharePoint
 Chart for SharePoint
 Gauge for SharePoint
 Map for SharePoint
 Barcode for SharePoint
 Open Vision for .NET


 Vision for .NET