Nevron Logo

ASP.NET Chart Range Indicators

Range Indicators

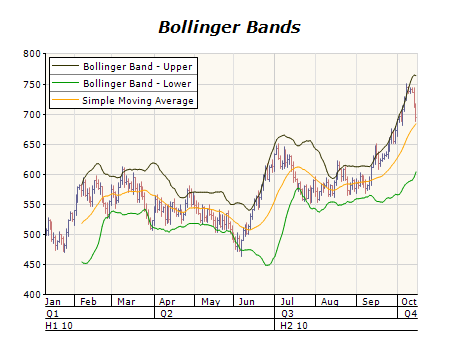
Range indicators are technical tools investors use to measure the volatility of a security's price movements. Bollinger Bands are a popular range indicator that uses a given number of standard deviations from a moving average to create upper and lower bands. As a measure of volatility, these bands adjust according to market conditions by widening during more volatile periods and contracting during calmer ones. Conversely, envelopes are range indicators consisting of two Moving averages, one shifting upward and the other downward. These indicators give investors valuable insights into potential price breakouts and reversals, helping them make informed investment decisions.

Bollinger Bands

Bollinger Bands, created by John Bollinger, are a popular range indicator traders and investors use to measure market volatility. The bands are based on a moving price average and are drawn at a certain number of standard deviations away from the average. As a measure of volatility, the bands self-adjust, expanding during high volatility and contracting during periods of low volatility. This makes them useful for identifying potential trading opportunities and managing risk in changing market conditions.

Envelope

An Envelope is a range indicator consisting of two Moving averages, with one average shifting upward and the other shifting downward. This creates a band or Envelope around the price that can be useful for determining potential support and resistance levels. Envelopes are a popular tool for trend-following traders, as they can help identify entry and exit points based on price movement within the band. By adjusting the length of the moving averages, traders can customize the Envelope to suit their specific trading strategy and market conditions.