+1-888-201-6088 | email@nevron.com
Log In
Nevron logo
Nevron word
PRODUCTS
DOWNLOADS
ORDER
SUPPORT
CONSULTING
COMPANY

Development Tools

Open Vision for .NET

NOV User Interface for .NET

NOV Grid for .NET

NOV Rich Text Editor for .NET

NOV Diagram for .NET

NOV Chart for .NET

NOV Gauge for .NET

NOV Schedule for .NET

NOV Barcode for .NET

Vision for .NET

Chart for .NET

Diagram for .NET

User Interface for .NET

3DChart for ActiveX

BI and Reporting Tools

Vision for SharePoint

Chart for SharePoint

Gauge for SharePoint

Map for SharePoint

Barcode for SharePoint

Vision for SSRS

Chart for SSRS

Gauge for SSRS

Map for SSRS

Barcode for SSRS

All Products

Office Products

Nevron writer shadow

Nevron Writer

favicon 3 2x 32

MyDraw

Nevron calendar shadow

Nevron Calendar

Download Free & Fully Functional Product Trials

Development Tools

Open Vision for .NET

including:

Vision for .NET

including:

3DChart for ActiveX

BI and Reporting Tools

Vision for SharePoint

including:

Vision for SSRS

including:

All Downloads

Development Tools

Open Vision for .NET

including:

Vision for .NET

Chart for .NET
Diagram for .NET
User Interface for .NET
3DChart for ActiveX

BI and Reporting Tools

Vision for SharePoint

Chart for SharePoint
Gauge for SharePoint
Map for SharePoint
Barcode for SharePoint

Vision for SSRS

Chart for SSRS
Gauge for SSRS
Map for SSRS
Barcode for SSRS
Promotions
Ordering Info
Sales FAQ
Licensing
Policies
Custom Payment

See All Prices

Tech Support
Live Demos
Documentation
Knowledge Base
Forums
Support Portal
Consulting Services
Custom Development
Complete Solutions
Training
About Us
News & Events
Careers
Customers
Case Studies
Testimonials
Awards
Partners
MVP Program
User groups
Contact Us
Home
Products
Nevron Open Vision
Nevron Vision for .NET
Nevron Vision for SharePoint
Nevron Vision for SSRS
Downloads
Purchase
Support
Consulting
About
Contacts

SharePoint Chart Line Studies

Home>Products>Vision for SharePoint>Chart for SharePoint>Gallery
logo chart sharepoint
Download Trial
Live Demo
Purchase

Chart Types

Bar Chart
Pie Chart
Line Chart
Area Chart
Float Bar Chart
Point Chart
Bubble Chart
Grid Surface Chart
Mesh Surface Chart
Triangulated Surface Chart
Radar Chart
Polar Chart
High-Low Chart
Error Bar Chart
Funnel Chart
Box And Whiskers Chart
Combo Chart
Stock Chart
Kagi Chart
Renko Chart
Point And Figure Chart
Three Line Break Chart
Vector Chart
Range Chart
Tree Map Chart

Scales, Axes & Walls

Scale Breaks
Axes & Walls in 2D
Chart Walls

Presentation

Background & Frame
Contours & Image Effects
Data Markers in 2D
Data Markers in 3D
Fill Styles
Lighting
Material
Series Attributes
Shape Series Style in 3D
Shapes as Bar Style in 3D
Shapes in 2D
View Projection

Functions & Line Studies

Basic Functions
Min, Max, Average, Sum
Power, Cumulative
Moving Average
Price Indicators
Range Indicators
Directional Movement
Technical Price Indicators
Volume Indicators
>
Line Studies

Panels

Anchor Panels and Annotations
Legends
Labels
Watermarks
Dashboards

Featured Example:

Automatic Scatter Data Label Layout

Trendline

Trend lines
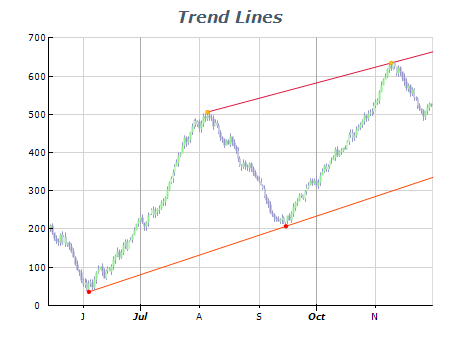
Line Studies are lines and various geometric figures that are plotted in price charts or in indicator charts. They are used as analytical instruments helping to define channels, support and resistance levels and trend changes and to forecast price dynamics. The trendline is a straight line that connects two price points and depicts the general direction in which a security is headed. It extends into the future to act as a line of support or resistance.

Fibonacci Arcs

Fibonacci arcs
Fibonacci arcs are created by drawing an invisible trendline between two points, and then drawing three curves that intersect this trendline at the key Fibonacci levels of 38.2, 50 and 61.8%. Fibonacci Arcs are considered to represent potential support and resistance levels. Fibonacci Arcs and Fibonacci Fans are usually plotted together on the chart. Support and resistance levels are determined by the points of intersection of these lines.

Fibonacci Fans

Fibonacci fans
A trend line is drawn between two extreme points. Then an invisible vertical line is drawn through the second extreme point. Three trend lines are drawn from the first extreme point, so that they intersect the invisible vertical line at Fibonacci levels of 38.2, 50, and 61.8%. These lines are considered to represent support and resistance levels. For getting a more precise forecast, it is recommended to use other Fibonacci instruments along with the Fan.

Fibonacci Retracements

Fibonacci retracements
Fibonacci Retracements are nine horizontal lines intersecting the trend line between two points at Fibonacci levels of 0.06, 38.2, 50, 61.8, 100, 161.88, and 423.6%. After a significant change, prices often return to their previous levels correcting an essential part of their initial movement. Prices often face support/resistance at the level of Fibonacci Retracements or near them in the course of such a movement.

Quadrant Lines

Quadrant lines
Quadrant Lines are a series of horizontal lines that divide the space between highest and lowest values into four equal sections. They are primarily intended to aid in the visual inspection of price movements.

Speed Resistance Lines

Speed resistance lines
Speed Resistance Lines (also called 1/3 - 2/3 lines) are a series of trendlines that divide a price move into three equal sections. They are similar in construction and interpretation to Fibonacci Fans.
Trend lines
Fibonacci arcs
Fibonacci fans
Fibonacci retracements
Quadrant lines
Speed resistance lines

Next Steps:

Download Free 60-Day Trial

Purchase Chart for SharePoint

Products
Open Vision for .NET
NOV UI for .NET
NOV Grid for .NET
NOV Rich Text for .NET
NOV Diagram for .NET
NOV Chart for .NET
NOV Gauge for .NET
NOV Schedule for .NET
NOV Barcode for .NET
Vision for .NET
Chart for .NET
Diagram for .NET
User Interface for .NET
Vision for SharePoint
Chart for SharePoint
Gauge for SharePoint
Map for SharePoint
Barcode for SharePoint
Vision for SSRS
Chart for SSRS
Gauge for SSRS
Map for SSRS
Barcode for SSRS
3DChart for ActiveX
Downloads
Order
Promotions
Ordering Info
Sales FAQ
Licensing
Policies
Custom Payment
Support
Live Demos
Documentation
Knowledge Base
Forums
Support Portal
Consulting
Custom Development
Complete Solutions
Training
About Us
News & Events
Careers
Customers
Case Studies
Testimonials
Awards
Partners
MVP Program
User groups
Contact Us
Connect with Us:
Contact Us
Privacy Policy
Terms of Use
Copyright © 1998-2018 Nevron Software LLC. All rights reserved.
Powered by Nevron CMS.