| | |
 | The Average True Range is a volatility indicator. It is calculated as Modified Moving Average of the True Range. |
|
|
![Technical price indicators chart chaikin volatility]() | Chaikin's Volatility indicator compares the spread between a security's high and low prices. It quantifies volatility as a widening of the range between the high and the low price. |
|
|
![Technical price indicators chart commodity channel index]() | 
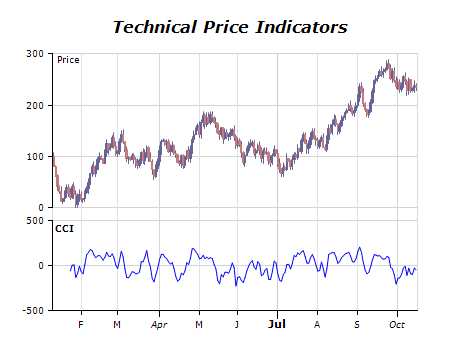
The Commodity Channel Index (CCI) measures the variation of a security's price from its statistical mean. High values show that prices are unusually high compared to average prices whereas low values indicate that prices are unusually low. Contrary to its name, the CCI can be used effectively on any type of security, not just commodities. |
|
|
![Technical price indicators chart detrended price oscilliator]() | The Detrended Price Oscillator attempts to eliminate the trend in prices. Detrended prices allow you to more easily identify cycles and overbought/oversold levels. |
|
|
![Technical price indicators chart macd]() | The Moving Average Convergence Divergence (MACD) is a trend following momentum indicator that shows the relationship between two moving averages of prices. It is calculated by subtracting the value of a 26-day exponential moving average from a 12-day exponential moving average. The MACD proves most effective in wide-swinging trading markets. |
|
|
![Technical price indicators chart mass index]() | The Mass Index was designed to identify trend reversals by measuring the narrowing and widening of the range between the high and low prices. As this range widens, the Mass Index increases; as the range narrows the Mass Index decreases. |
|
|
![Technical price indicators chart momentum]() | The Momentum indicator measures the amount that a security's price has changed over a given time span. It can be used as a trend-following oscillator similar to the MACD or as a leading indicator. The formula of the momentum is: Momentum[n] = A1[n] - A1[n - period] |
|
|
![Technical price indicators chart performance]() | The Performance indicator displays a security's price performance as a percentage. This is sometimes called a "normalized" chart. |
|
|
![Technical price indicators chart rate of change]() | Rate of Change indicator is measuring the rate at which price is changing. |
|
|
![Technical price indicators chart relative strength index]() | The RSI is a price-following oscillator that ranges between 0 and 100. The formula of the RSI is: RSI[n] = 100 - (100 / (1 + U[n] / D[n])). U[n] - average value of the upward price change for the given period. D[n] - average value of the downward price change for the given period. |
|
|
![Technical price indicators chart standard deviation]() | Standard Deviation is a statistical measure of volatility. Standard Deviation is typically used as a component of other indicators, rather than as a stand-alone indicator. For example, Bollinger Bands are calculated by adding a security's Standard Deviation to a moving average. |
|
|
![Technical price indicators chart stochastic osciliator]() | The Stochastic Oscillator compares where a security's price closed relative to its price range over a given time period. Closing levels that are consistently near the top of the range indicate buying pressure. Those near the bottom of the range indicate selling pressure. |
|
|
![Technical price indicators chart williams r]() | Williams %R is a momentum indicator that measures overbought/oversold levels. This indicator was developed by Larry Williams. |
|
|
![Technical price indicators chart trix]() | TRIX is a momentum indicator that displays the percent rate-of-change of a triple exponentially smoothed moving average of the security's closing price. It is designed to keep you in trends equal to or shorter than the number of periods you specify. |
|
| |
|