Nevron Logo

WPF Point And Figure Chart

Point and Figure Chart

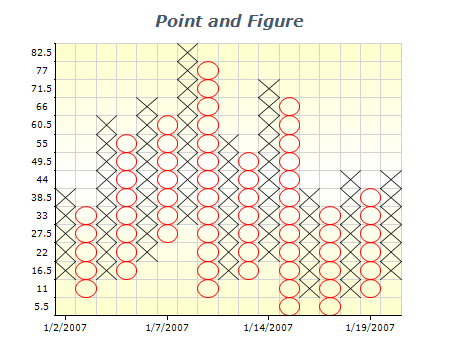
Point and Figure charts are a popular charting technique used in technical analysis to identify support and resistance levels and chart patterns. These charts consist of X's or O's columns, representing uptrends and downtrends, respectively. Unlike other charting techniques, Point and Figure charts ignore the time factor and solely focus on price movements. By analyzing these charts, traders can gain insights into the market's direction and make informed trading decisions.

Sample Table Format

PriceX O X O
20.000 X X
19.875 X
19.125 O
19.000 X O

Each row in this table represents a specific price level, and columns X’s and O's represent the price movements.

Best practices for using point and figure charts

  • Determine the box size and reversal criteria. The box size determines the price range of each box on the chart, while the reversal criteria determine when a new column is started on the chart. These parameters are important as they can affect the sensitivity and accuracy of the chart.
  • Use a consistent price scale. Point and Figure charts are not time-based but rather based on price movements. A consistent price scale on the chart is essential for accurate analysis and comparison.