ProductsAll Products
.NET Components
DownloadsAll Downloads
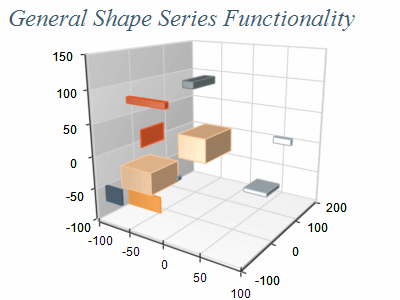
The Shape Series allows for the display of a wide range of customizable shapes in a 3D chart. With this series, you can define the centers and dimensions of the shapes to create various visualizations. The Shape Series is commonly used in fields such as architecture, engineering, and manufacturing, where it can be used to visualize complex structures and designs.
| ||||||||||||||||
|
| Data Point | Shape Type | Dimensions | Center |
|---|---|---|---|
| 1 | Sphere | 10,10,10 | 5,5,5 |
| 2 | Cylinder | 10,10,10 | 5,5,5 |
| 3 | Cube | 10,10,10 | 15,15,15 |