| | |
 | A 2D Funnel Chart is an excellent visual for displaying progressively decreasing values, such as sales process stages or any similar process of gradual elimination. This type of chart represents the flow of potential customers through various stages until only a few make a purchase. The funnel chart's distinctive shape, with a wide top and narrow bottom, makes it easy to see where the drop-off occurs and identify areas for improvement in the process. |
|
|
![3d funnel chart]() | A 3D funnel chart is a powerful visual representation of sales or the gradual elimination process. The chart is shaped like a funnel, with the widest part at the top representing the initial stage and the narrowest part at the bottom representing the final stage. It is an efficient way to identify areas for improvement and optimize the sales process for maximum efficiency. |
|
|
![advanced 2d funnel chart]() | An Advanced 2D Funnel Chart is valuable for representing data with custom X sizes for each item in the funnel. It is commonly used to analyze sales data and identify the areas where improvements can be made. The chart has a distinctive shape with a wide top and narrow bottom, representing the gradual elimination of potential customers at each stage of the sales process. |
|
|
![advanced 3d funnel chart]() | An advanced 3D funnel chart is a great way to visualize data with custom X sizes of funnel data items. This chart type can represent various processes with a gradual decrease in data points. With the added dimension, users can better understand the data and identify trends that might not be as visible in 2D funnel charts. It is an excellent tool for business analysts, sales managers, and marketers to analyze sales processes and identify areas of improvement. |
|
|
![advanced 3d funnel no gaps]() | A 3D Funnel Chart with custom X sizes and no gaps between the funnel data items. |
|
| |
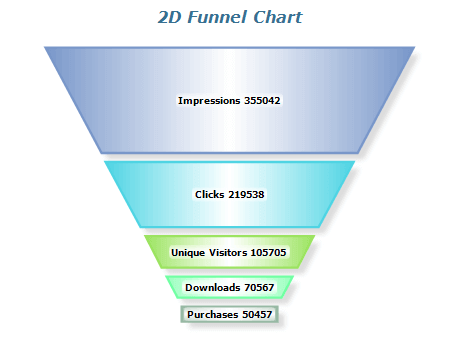
Funnel charts represent stages in a process or data progression through a sequence. With a funnel chart, you can quickly see how the data flows through each
stage and identify areas where the flow is hindered. Funnel charts get their name from their unique shape, which is widest at the top and narrowest at the bottom,
resembling a funnel. This shape makes it easy to compare the values of each stage, and the colors can be customized to provide additional context or highlight specific stages.
Funnel charts are versatile tools that analyze data types, such as sales or website traffic. By visualizing data in a funnel chart, you can gain insights into the progression of your data through different stages and identify areas for improvement.
This makes funnel charts an effective way to optimize processes and achieve better results.
|
Stage | Visitors | Leads | Opportunities | Sales |
---|
Awareness | 1000 | 500 | 100 | 20 | Interest | 500 | 250 | 75 | 15 | Consideration | 200 | 100 | 50 | 10 | Decision | 100 | 50 | 25 | 5 |
In this example, each row represents a process stage, such as awareness or consideration. The columns in the Funnel Chart represent the number of visitors at
each stage and the number of conversions that occur, such as leads, opportunities, and sales. This helps to visualize the flow of potential customers through
various stages and identify areas where the process may need improvement. This table can be used to create a funnel chart that visualizes the data flow through each stage,
making it easy to spot any bottlenecks or areas where the flow is impeded.
|
- Keep it simple: The funnel chart should be easy to read and understand, so it's best to avoid cluttering it with unnecessary details.
- Use meaningful categories: The categories should be descriptive and meaningful so it's clear what each stage of the funnel represents.
- Order the categories logically: The categories should be ordered in a logical sequence that reflects the data flow through the funnel.
- Use consistent units: Make sure the units used for each funnel stage are consistent throughout the chart.
- Avoid too many categories: A funnel chart with too many categories can be overwhelming and difficult to read. It's best to limit the number of categories to 5-7, if possible.
- Highlight the drop-off rate: Use color or other visual cues to highlight the drop-off rate at each stage of the funnel, as this can help identify areas for improvement.
|
|