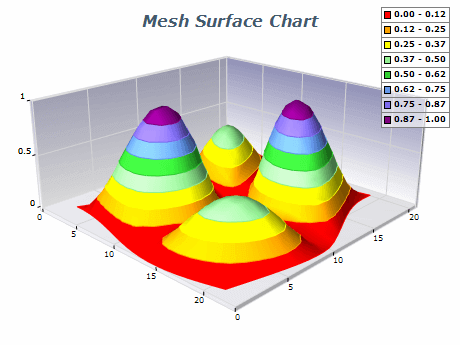
| | |
 | The Mesh Surface chart displays a surface with user-defined y-position, x-position and z-position values for each data point, in contrast to Grid Surface where only y-position (elevation) is user defined. Data points are ordered in a regular network. |
|
|
![mesh surface 3d spiral chart]() | A Mesh Surface 3D, 3D Spiral chart, a powerful tool for visualizing data in three dimensions. This chart type allows for the display of complex data sets with a unique spiral pattern that emphasizes the 3D aspect of the data. The Spiral pattern is created by plotting data points in a Spiral pattern along a helix, with the position of each point determined by its x, y, and z coordinates. The result is a visually stunning, informative, and easy-to-understand chart.
Mesh Surface 3D Spiral charts are handy for displaying data with multiple dimensions, such as scientific or engineering data, as they allow users to see relationships between different variables. The Spiral pattern also provides a sense of motion and directionality, making it easier to interpret trends and past practices of the data. > |
|
|
![mesh surface with texture and frame]() | A Mesh Surface chart with texture and mesh frame is an advanced chart type that allows users to create highly customizable and visually stunning charts. The Mesh Surface series supports a FillEffect for the whole surface, meaning users can apply a wide range of textures and patterns to the chart surface. This includes images, gradients, advanced gradients, and more.
In addition to texture, users can also modify material properties such as Specular Color, Emissive Color, and Shininess to achieve a specific look and feel for their chart. This level of customization makes Mesh Surface charts with texture and mesh frame an ideal tool for displaying complex data sets in a visually appealing and easy-to-understand format.
The mesh frame is another important feature of Mesh Surface charts, as it adds a visual element that emphasizes the three-dimensional nature of the data. This frame is created by plotting data points in a regular network and can be customized with different colors and styles to match the chart's overall design.
|
|
|
![intersected surfaces chart]() | Intersected Mesh Surfaces are a popular chart type for visualizing complex data in three dimensions. This chart type can show the intersection of two or more mesh surfaces, providing valuable insights into the relationships between different variables in the data set.
However, when using intersected Mesh Surfaces, it's essential to use settings for surface filling to ensure that the data is easy to read and understand. By configuring the surface-filling settings effectively, users can optimize the clarity of the Mesh Surface chart and improve the identification of data patterns and trends.
To achieve this, one approach is to utilize a color scheme that creates a clear contrast between the surfaces in the chart and the background, facilitating easy identification of each surface. Another approach is to use transparency or opacity settings to allow overlapping surfaces to blend together in a visually pleasing way while still maintaining the distinctiveness of each surface.
Overall, by using intersected Mesh Surfaces with the right settings for surface filling, users can create powerful visualizations that provide a clear and accurate representation of complex data sets. With the ability to customize every aspect of the chart, this chart type is an excellent choice for anyone looking to showcase multidimensional data in a compelling and informative way. |
|
|
![mesh surface with empty data points]() | Mesh Surface charts with empty data points are an advanced chart type that provides excellent flexibility and customization for users. Empty data points refer to data points specified with no value supplied, which are not rendered by the chart. This allows users to create empty shifts in a dimension scale, providing a more comprehensive representation of the data.
By using empty data points, users can create Mesh Surface charts that accurately represent multidimensional data, even when certain variables are not present. This feature is particularly useful when data is incomplete or specific data points are missing.
Mesh Surface charts with empty data points can be customized with various other settings to create a visually stunning and informative chart. Users can apply different color schemes and fill effects to the chart surface and modify material properties like Specular Color, Emissive Color, and Shininess to achieve a specific look and feel.
Mesh Surface charts with empty data points are an excellent choice for creating a dynamic and customizable chart that accurately represents complex data sets. With the ability to customize every aspect of the chart, this chart type provides a powerful tool for visualizing data and communicating insights to others. |
|
| |
A Mesh Surface chart is a type of graphical representation that displays a surface with user-defined Y-position,
X-position, and Z-position values for each data point. Unlike a Grid Surface chart, which only allows users to define
the y-position or elevation, Mesh Surface provides more precise control over the position of each data point. The data
points are organized in a regular network, creating a mesh-like appearance. A variation of the Mesh Surface chart allows
the user to specify a color per each data point, thus adding a fourth dimension of data to the chart.
Mesh Surface charts are commonly used in scientific and engineering applications, allowing for more detailed visualizations of complex data sets.
|
X Value | Y Value | Z Value |
---|
1 | 1 | 10 | 1 | 2 | 20 | 1 | 3 | 30 | 2 | 1 | 40 |
The table includes x, y, and z positions for each data point. The x values represent the horizontal position,
the y values represent the vertical position or elevation, and the z values represent the data or measurement
at each point. This table can be used for creating a Mesh Surface chart that displays a surface with a regular network of data points.
|
- Choose the right type of chart: Mesh Surface charts are best used when displaying data with multiple dimensions or parameters. Consider whether a Mesh Surface chart is the best way to represent your data or if a different chart type, such as a 3D Scatter plot or a Heatmap, would be more appropriate.
- Simplify the data: Mesh Surface charts can be complex and overwhelming if there are too many data points or if the data is too detailed. Simplify your data by removing unnecessary data points or grouping data into larger categories.
- Choose an appropriate color scheme: Colors are important in Mesh Surface charts, as they help to differentiate between different data points. Choose a color scheme that is appropriate for your data and easy to interpret. Use a legend to explain the meaning of each color.
- Label axes clearly: Label the x, y, and z axes to ensure the chart is easily interpretable. Include units of measurement if necessary.
- Use lighting and shading appropriately: Lighting and shading can enhance the 3D effect of Mesh Surface charts. Experiment with different lighting and shading options to find the best way to represent your data.
- Provide context for the data by including a title, captions, and annotations. Explain the purpose of the chart, the meaning of the data, and any relevant background information.
|
|