| | |
 | The Combo Chart is versatile charting type, which allows you to specify a series type per each values data grouping, which is displayed in the combo chart area. This is a combination of clustered bar chart and line series. |
|
|
![combo chart 3d bar point smooth area]() | A 3D Combo Chart combines different chart series, such as bar, point, and smooth area charts, in a 3D format. This chart type provides a more immersive and dynamic way of visualizing complex data sets, allowing users to gain deeper insights and make more informed decisions. |
|
|
![pareto chart]() | A Pareto chart displays individual values in descending order using bars, while the cumulative total is represented by a line. This chart type is commonly used in quality control and business management to identify the most significant factors contributing to a problem or issue. The Pareto chart is a valuable tool that helps decision-makers prioritize their efforts by displaying the most critical factors first and efficiently identifying the root causes of a problem. Utilizing this powerful tool can enable organizations to save time, money, and resources by focusing on the factors that have the most significant impact on their operations. |
|
|
![financial combo chart]() | Financial charts commonly display stock market data and other financial information. One essential feature of financial charts is the ability to skip date/time ranges where no data is expected, typically on weekends or holidays. This feature is made possible through timelines and date/time scales, allowing users to display only the needed data and making the chart more streamlined and easier to read. By displaying only working weekdays, financial charts can help users better understand the trends and patterns of the market without being distracted by irrelevant data. This feature is handy in financial charting, where time and accuracy are paramount. With this powerful tool, financial analysts can make informed decisions based on accurate data, resulting in better outcomes for their clients and their business. |
|
| |
A Combo Chart is a versatile charting type that combines a clustered bar chart and line series, allowing you to display multiple data series in one chart area. This chart type allows you to specify a series type for each data grouping, giving you more control over how your data is displayed.
With a Combo Chart, you can easily compare data types, such as sales revenue and profit margin, in a single chart. The chart allows you to display each data series using the most appropriate chart type, such as a clustered bar chart or a line series.
The Combo Chart is a valuable tool for analyzing complex datasets and identifying patterns and trends in your data. With its ability to display multiple data series in one chart area, you can quickly and easily compare data and make informed decisions based on your findings.
|
Month | Sales Revenue (Bar) | Profit Margin (Line) | Customer Acquisition (Bar) | Employee Satisfaction (Line) |
---|
Jan-21 | 500 | 10% | 50 | 75% | Feb-21 | 600 | 12% | 60 | 80% | Mar-21 | 700 | 15% | 70 | 85% | Apr-21 | 800 | 20% | 80 | 90% | May-21 | 900 | 18% | 90 | 95% | Jun-21 | 1000 | 22% | 100 | 90% |
In this example, the Sales Revenue and Customer Acquisition data series are represented
as bar charts, while the Profit Margin and Employee Satisfaction data series are displayed
as line charts. This allows for easy comparison of the different data types,
with each series represented using the most appropriate chart type.
|
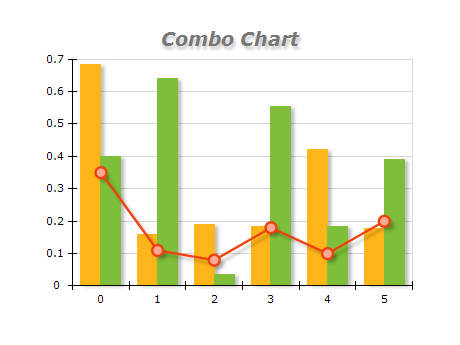
Combo charts are helpful when you want to display multiple data types on a single chart. Here are some best practices for using combo charts:
- Choose the right chart types: Combo charts can include different charts, such as bar, line, and scatter. Choose the chart types that best represent the data you want to display. For example, if you show how sales revenue and profit margin change over time, a line chart might be best for revenue, while a bar chart might be best for profit margin.
- Use consistent axes: When using multiple chart types on a single chart, it's important to ensure they are consistent across all the chart types. This means that the scales and units used on the axes should be the same. If the scales or units differ, it can be difficult for viewers to compare the data accurately.
- Limit the number of chart types: While combo charts can help display multiple data types, it's important not to overload the chart with too many. Generally, limiting the chart to at least two or three chart types is best.
- Use color and labeling effectively: To help viewers understand the chart, use color and labeling. Use different colors for each chart type to clarify which data points belong to which one. Label each chart type clearly, and include a legend to help viewers understand what each color represents.
- Choose the proper chart layout: There are different ways to layout a combo chart, such as overlaying the chart types or using multiple axes. Choose the layout that best suits the data you want to display and makes it easy for viewers to understand the relationships between the data points.
|
|