|
 | Point Charts display 1, 2 or 3-dimensional data as points in a Cartesian coordinate system. Values are represented by the position of the points on the chart. Point series is mainly intended to display discrete sets of independent values. However, it may also be used as an alternative to line or bar series. |
|
|
In XYZ scatter mode, Point series may be used for presentation of data that is irregularly spread throughout 3D space using custom x and z values for the data points. |  |
|
|
 | Multiseries XYZ scatter Point charts are suitable for representing the relative 3D distribution of several different datasets. |
|
|
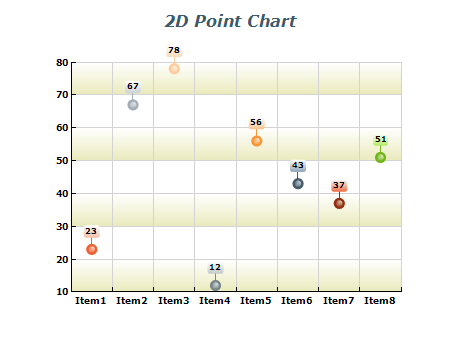
In XY scatter mode, Point series may be used for presentation of data that is irregularly spread throughout 2D space using custom x values for the data points. The point series supports a special rendering mode called clustered rendering, which allows you to render very large datasets. Clustering works by identifying densely populated regions of data, which are later visualized by a lesser number of points. This reduces the number of visual points on the screen and therefore improves performance. |  |
|
|
 | The point series supports a special rendering mode called clustered rendering, which allows you to render very large datasets. Clustering works by identifying densely populated regions of data, which are later visualized by a lesser number of points. This reduces the number of visual points on the screen and therefore improves performance. |
|
|
The point series supports a special rendering mode called fast point rendering, which allows you to render millions of data points using GPU acceleration. In this image, the series renders a cloud of 2D points with randomly generated custom colors. |  |
|
|
 | A 3D Cloud of millions of points rendered using the fast point series using GPU acceleration. Like in the case of 2D you can also assign custom colors per vertex. |
|
|
A FastPoint series visualizing a 3D LiDAR point cloud of the Empire State Building neighborhood in New York City. The FastPoint Series includes built-in support for importing .LAS, .LAZ, and ASC grid data formats. | 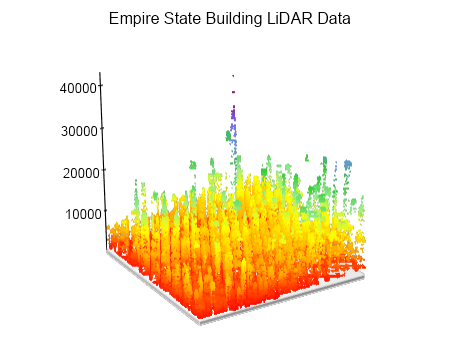 |
|
|


