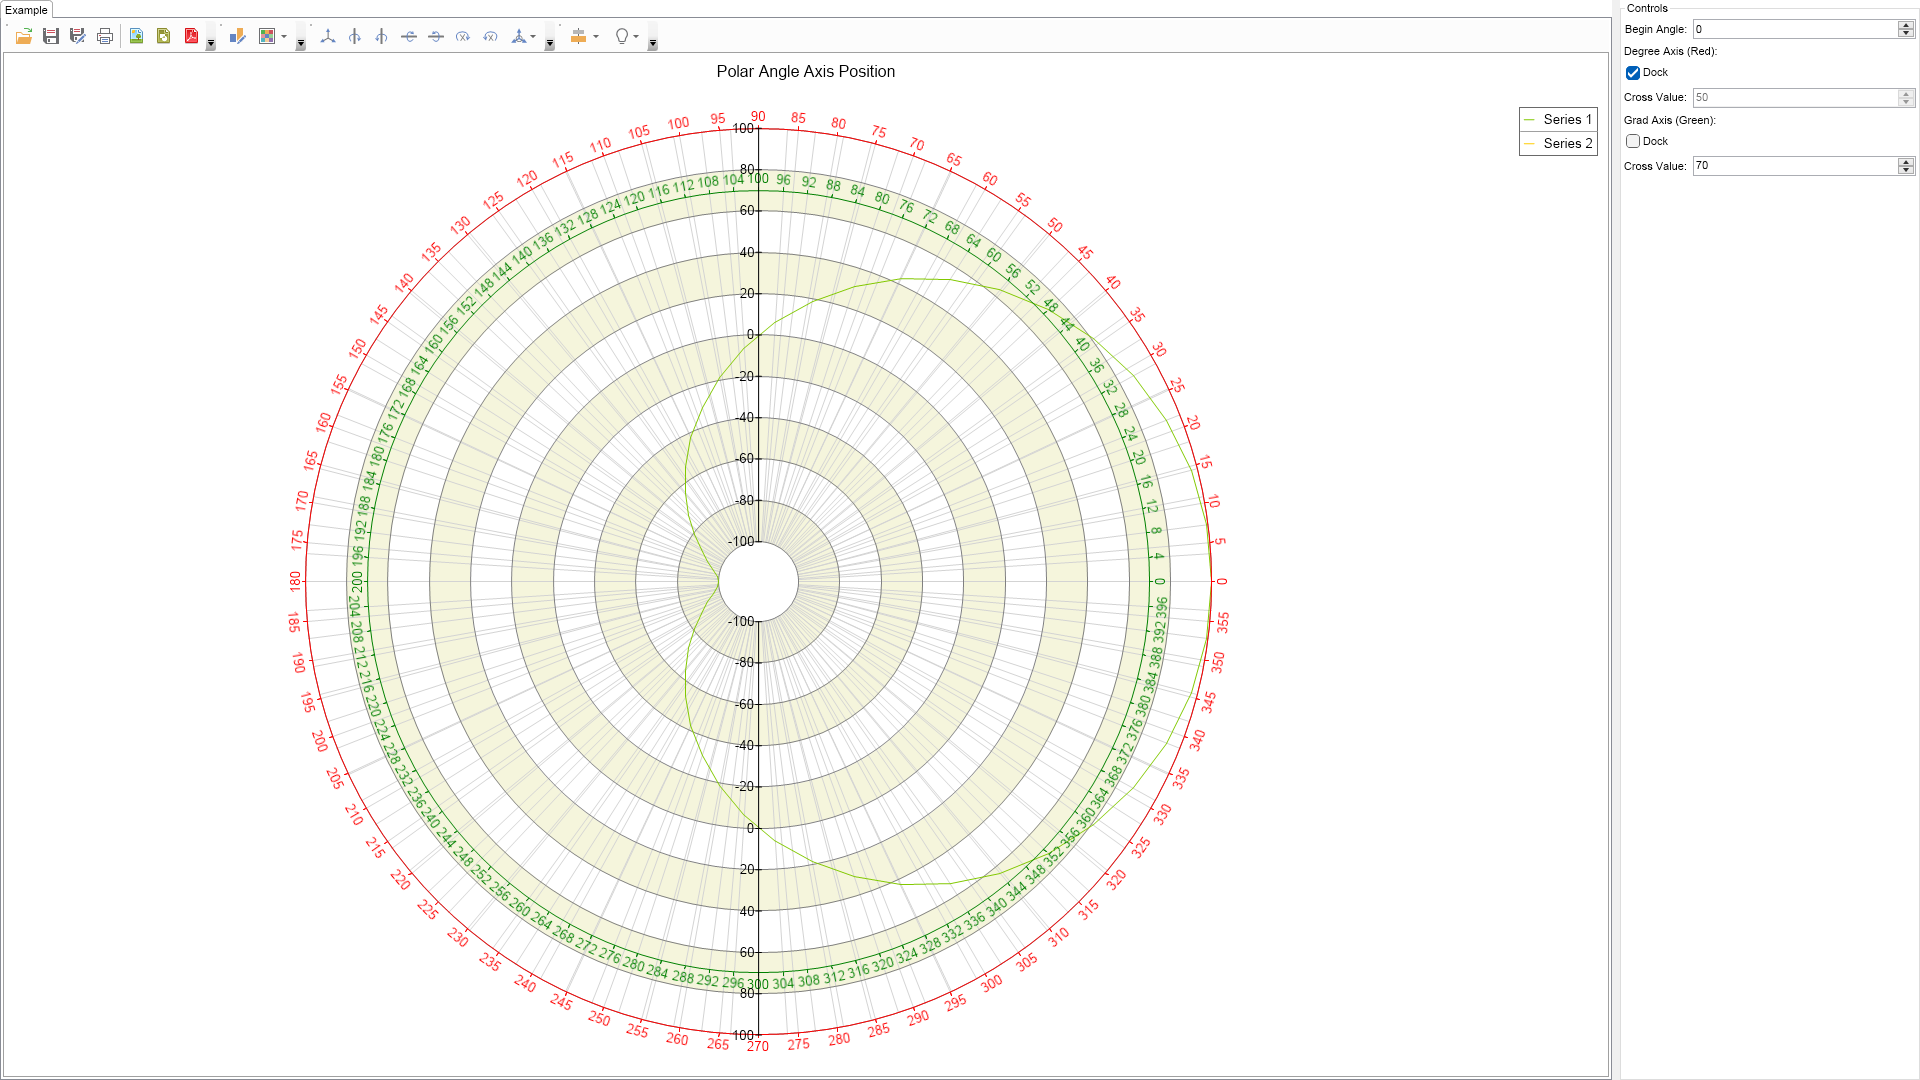
using Nevron.Nov;
using Nevron.Nov.Chart;
using Nevron.Nov.Dom;
using Nevron.Nov.Graphics;
using Nevron.Nov.Layout;
using Nevron.Nov.UI;
using Nevron.Nov.Windows.Forms;
using System;
using System.Windows.Forms;
namespace NovWinFormsProject
{
public partial class Form1 : Form
{
#region Constructors
public Form1()
{
InitializeComponent();
// Set form title
Text = "NOV WinForms - NPolarAngleAxisPositionExample";
// Create the NOV example and its controls
NWidget exampleContent = CreateExampleContent();
NWidget exampleControls = CreateExampleControls();
if (exampleControls != null)
{
exampleControls.PreferredWidth = 300;
}
// Place the example and its controls in a pair box
NPairBox pairBox = new NPairBox(exampleContent, exampleControls);
pairBox.FillMode = ENStackFillMode.First;
pairBox.FitMode = ENStackFitMode.First;
pairBox.Margins = new NMargins(NDesign.HorizontalSpacing, NDesign.VerticalSpacing);
// Host the example in the form
NNovWidgetHost host = new NNovWidgetHost(pairBox);
host.Dock = DockStyle.Fill;
Controls.Add(host);
}
#endregion
#region Example
public NWidget CreateExampleContent()
{
NChartViewWithCommandBars chartViewWithCommandBars = new NChartViewWithCommandBars();
NChartView chartView = chartViewWithCommandBars.View;
chartView.Surface.CreatePredefinedChart(ENPredefinedChartType.Polar);
// configure title
chartView.Surface.Titles[0].Text = "Polar Angle Axis Position";
// configure chart
m_Chart = (NPolarChart)chartView.Surface.Charts[0];
m_Chart.SetPredefinedPolarAxes(ENPredefinedPolarAxes.AngleSecondaryAngleValue);
// setup chart
m_Chart.InnerRadius = 40;
// create a polar line series
NPolarLineSeries series1 = new NPolarLineSeries();
m_Chart.Series.Add(series1);
series1.Name = "Series 1";
series1.CloseContour = true;
series1.DataLabelStyle = new NDataLabelStyle(false);
series1.MarkerStyle = new NMarkerStyle(false);
series1.UseXValues = true;
Curve1(series1, 50);
// create a polar line series
NPolarLineSeries series2 = new NPolarLineSeries();
m_Chart.Series.Add(series2);
series2.Name = "Series 2";
series2.CloseContour = true;
series2.DataLabelStyle = new NDataLabelStyle(false);
series2.MarkerStyle = new NMarkerStyle(false);
series2.UseXValues = true;
Curve2(series2, 100);
// setup polar axis
NLinearScale linearScale = (NLinearScale)m_Chart.Axes[ENPolarAxis.PrimaryValue].Scale;
linearScale.ViewRangeInflateMode = ENScaleViewRangeInflateMode.MajorTick;
linearScale.InflateViewRangeBegin = true;
linearScale.InflateViewRangeEnd = true;
linearScale.MajorGridLines.Visible = true;
linearScale.MajorGridLines.Stroke = new NStroke(1, NColor.Gray, ENDashStyle.Solid);
NScaleStrip strip = new NScaleStrip();
strip.Fill = new NColorFill(NColor.Beige);
strip.Interlaced = true;
linearScale.Strips.Add(strip);
// setup polar angle axis
NAngularScale degreeScale = (NAngularScale)m_Chart.Axes[ENPolarAxis.PrimaryAngle].Scale;
degreeScale.MajorGridLines.Visible = true;
degreeScale.Labels.Style.Angle = new NScaleLabelAngle(ENScaleLabelAngleMode.Scale, 0);
// add a second value axes
NPolarAxis valueAxis = m_Chart.Axes[ENPolarAxis.PrimaryValue];
m_RedAxis = m_Chart.Axes[ENPolarAxis.PrimaryAngle];
m_GreenAxis = m_Chart.Axes[ENPolarAxis.SecondaryAngle];
NAngularScale gradScale = new NAngularScale();
gradScale.AngleUnit = NUnit.Grad;
gradScale.Labels.Style.Angle = new NScaleLabelAngle(ENScaleLabelAngleMode.Scale, 0);
m_GreenAxis.Scale = gradScale;
NValueAxisCrossing greenAxisCrossing = new NValueAxisCrossing(m_RedAxis, 70);
NCrossPolarAxisAnchor greenCrossAnchor = new NCrossPolarAxisAnchor(greenAxisCrossing, ENPolarAxisOrientation.Angle, ENScaleOrientation.Right);
m_GreenAxis.Anchor = greenCrossAnchor;
m_RedAxis.Anchor = new NDockPolarAxisAnchor(ENPolarAxisDockZone.OuterRim);
NValueAxisCrossing redAxisCrossing = new NValueAxisCrossing(m_RedAxis, 90);
NCrossPolarAxisAnchor redCrossAnchor = new NCrossPolarAxisAnchor(redAxisCrossing, ENPolarAxisOrientation.Value, ENScaleOrientation.Auto);
m_Chart.Axes[ENPolarAxis.PrimaryValue].Anchor = redCrossAnchor;
// apply style sheet
// color code the axes and series after the stylesheet is applied
m_RedAxis.Scale.SetColor(NColor.Red);
m_GreenAxis.Scale.SetColor(NColor.Green);
m_GreenAxis.VisibilityMode = ENAxisVisibilityMode.Visible;
series2.ValueAxis = m_GreenAxis;
return chartViewWithCommandBars;
}
public NWidget CreateExampleControls()
{
NStackPanel stack = new NStackPanel();
NUniSizeBoxGroup group = new NUniSizeBoxGroup(stack);
// begin angle
NNumericUpDown beginAngleUpDown = new NNumericUpDown();
beginAngleUpDown.ValueChanged += OnBeginAngleUpDownValueChanged;
stack.Add(NPairBox.Create("Begin Angle:", beginAngleUpDown));
// red axis controls
stack.Add(new NLabel("Degree Axis (Red):"));
NCheckBox dockRedAxisCheckBox = new NCheckBox("Dock");
stack.Add(dockRedAxisCheckBox);
m_RedAxisCrossValueUpDown = new NNumericUpDown();
stack.Add(NPairBox.Create("Cross Value:", m_RedAxisCrossValueUpDown));
// green axis controls
stack.Add(new NLabel("Grad Axis (Green):"));
NCheckBox dockGreenAxisCheckBox = new NCheckBox("Dock");
stack.Add(dockGreenAxisCheckBox);
m_GreenAxisCrossValueUpDown = new NNumericUpDown();
stack.Add(NPairBox.Create("Cross Value:", m_GreenAxisCrossValueUpDown));
// wire events
dockRedAxisCheckBox.CheckedChanged += OnDockRedAxisCheckBoxCheckedChanged;
m_RedAxisCrossValueUpDown.ValueChanged += OnRedAxisCrossValueUpDownValueChanged;
dockGreenAxisCheckBox.CheckedChanged += OnDockGreenAxisCheckBoxCheckedChanged;
m_GreenAxisCrossValueUpDown.ValueChanged += OnGreenAxisCrossValueUpDownValueChanged;
// init values
m_RedAxisCrossValueUpDown.Value = 50;
dockRedAxisCheckBox.Checked = true;
dockGreenAxisCheckBox.Checked = false;
m_GreenAxisCrossValueUpDown.Value = 70;
return group;
}
public string GetExampleDescription()
{
return @"This example demonstrates how to control the polar angle axis position.
";
}
///
/// Gets the relevant documentation links for the example
///
///
public (string Name, string Url)[] GetDocumentationUrls()
{
return new[]
{
("Polar Axes", "https://www.nevron.com/docs/openvision/polar-chart-axes.html"),
("Common Axis Functionality", "https://www.nevron.com/docs/openvision/chart-common-axis-functionality.html"),
};
}
#endregion
#region Implementation
internal static void Curve1(NPolarLineSeries series, int count)
{
series.DataPoints.Clear();
double angleStep = 2 * Math.PI / count;
for (int i = 0; i < count; i++)
{
double angle = i * angleStep;
double radius = 100 * Math.Cos(angle);
series.DataPoints.Add(new NPolarLineDataPoint(angle * 180 / Math.PI, radius));
}
}
internal static void Curve2(NPolarLineSeries series, int count)
{
series.DataPoints.Clear();
double angleStep = 2 * Math.PI / count;
for (int i = 0; i < count; i++)
{
double angle = i * angleStep;
double radius = 33 + 100 * Math.Sin(2 * angle) + 1.7 * Math.Cos(2 * angle);
radius = Math.Abs(radius);
series.DataPoints.Add(new NPolarLineDataPoint(angle * 180 / Math.PI, radius));
}
}
#endregion
#region Event Handlers
void OnBeginAngleUpDownValueChanged(NValueChangeEventArgs arg)
{
m_Chart.BeginAngle = new NAngle(((NNumericUpDown)arg.TargetNode).Value, NUnit.Degree);
}
void OnDockGreenAxisCheckBoxCheckedChanged(NValueChangeEventArgs arg)
{
if (((NCheckBox)arg.TargetNode).Checked)
{
m_GreenAxis.Anchor = new NDockPolarAxisAnchor(ENPolarAxisDockZone.OuterRim);
m_GreenAxisCrossValueUpDown.Enabled = false;
}
else
{
NCrossPolarAxisAnchor axisAnchor = new NCrossPolarAxisAnchor(ENPolarAxisOrientation.Angle, ENScaleOrientation.Auto);
axisAnchor.Crossing = new NValueAxisCrossing(m_Chart.Axes[ENPolarAxis.PrimaryValue], m_GreenAxisCrossValueUpDown.Value);
m_GreenAxis.Anchor = axisAnchor;
m_GreenAxisCrossValueUpDown.Enabled = true;
}
}
void OnGreenAxisCrossValueUpDownValueChanged(NValueChangeEventArgs arg)
{
NCrossPolarAxisAnchor axisAnchor = new NCrossPolarAxisAnchor(ENPolarAxisOrientation.Angle, ENScaleOrientation.Auto);
axisAnchor.Crossing = new NValueAxisCrossing(m_Chart.Axes[ENPolarAxis.PrimaryValue], m_GreenAxisCrossValueUpDown.Value);
m_GreenAxis.Anchor = axisAnchor;
}
void OnDockRedAxisCheckBoxCheckedChanged(NValueChangeEventArgs arg)
{
if (((NCheckBox)arg.TargetNode).Checked)
{
m_RedAxis.Anchor = new NDockPolarAxisAnchor(ENPolarAxisDockZone.OuterRim);
m_RedAxisCrossValueUpDown.Enabled = false;
}
else
{
NCrossPolarAxisAnchor axisAnchor = new NCrossPolarAxisAnchor(ENPolarAxisOrientation.Angle, ENScaleOrientation.Auto);
axisAnchor.Crossing = new NValueAxisCrossing(m_Chart.Axes[ENPolarAxis.PrimaryValue], m_RedAxisCrossValueUpDown.Value);
m_RedAxis.Anchor = axisAnchor;
m_RedAxisCrossValueUpDown.Enabled = true;
}
}
void OnRedAxisCrossValueUpDownValueChanged(NValueChangeEventArgs arg)
{
NCrossPolarAxisAnchor axisAnchor = new NCrossPolarAxisAnchor(ENPolarAxisOrientation.Angle, ENScaleOrientation.Auto);
axisAnchor.Crossing = new NValueAxisCrossing(m_Chart.Axes[ENPolarAxis.PrimaryValue], m_RedAxisCrossValueUpDown.Value);
m_RedAxis.Anchor = axisAnchor;
}
#endregion
#region Fields
NPolarChart m_Chart;
NPolarAxis m_RedAxis;
NPolarAxis m_GreenAxis;
NNumericUpDown m_GreenAxisCrossValueUpDown;
NNumericUpDown m_RedAxisCrossValueUpDown;
#endregion
#region Static Methods
#endregion
#region Constants
#endregion
#region Nested Types
#endregion
}
}

 Chart for .NET
 Diagram for .NET
 User Interface for .NET
 Vision for SSRS
 Chart for SSRS
 Gauge for SSRS
 Map for SSRS
 Barcode for SSRS
 Vision for SharePoint
 Chart for SharePoint
 Gauge for SharePoint
 Map for SharePoint
 Barcode for SharePoint
 Open Vision for .NET


 Vision for .NET