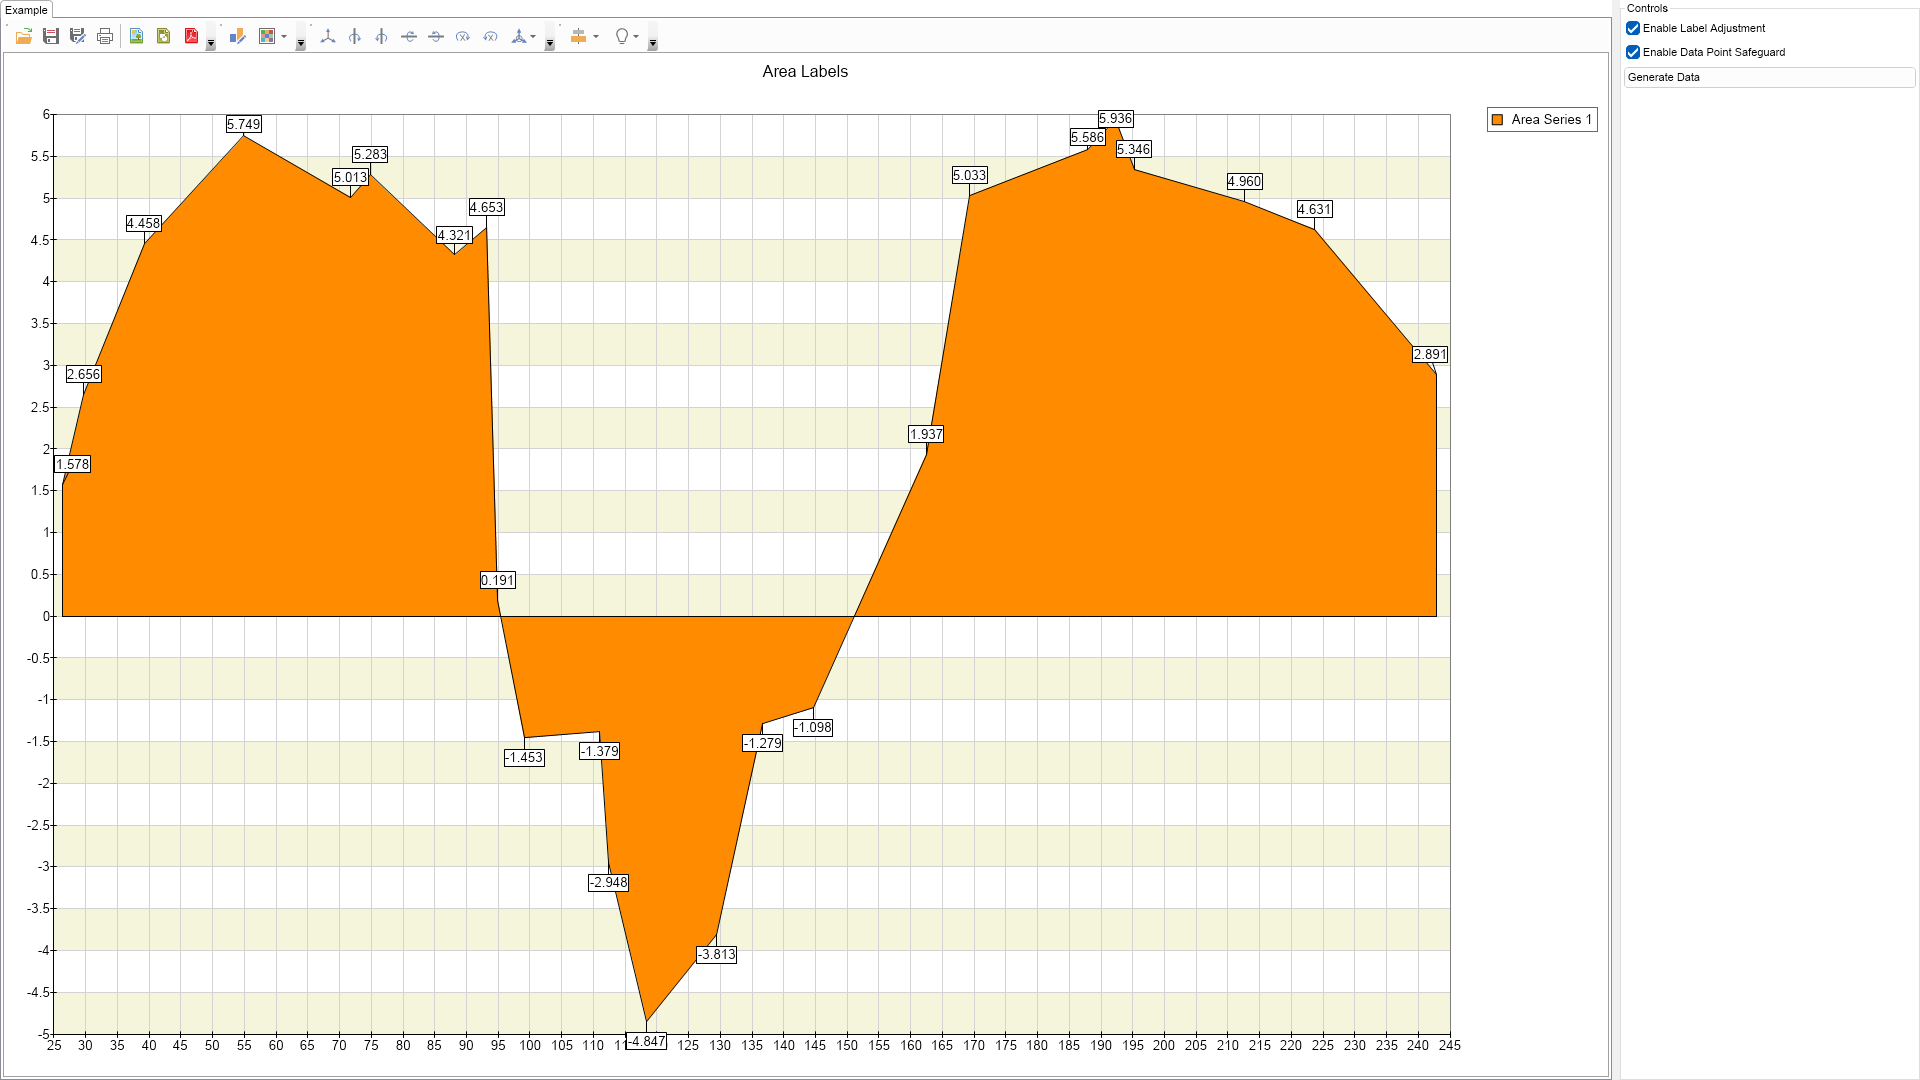
This example demonstrates how the automatic data label layout works with area data labels.

| Language: C# |
using Nevron.Nov;
using Nevron.Nov.Chart;
using Nevron.Nov.Dom;
using Nevron.Nov.Graphics;
using Nevron.Nov.Layout;
using Nevron.Nov.UI;
using Nevron.Nov.Windows.Forms;
using System;
using System.Windows.Forms;
namespace NovWinFormsProject
{
public partial class Form1 : Form
{
#region Constructors
public Form1()
{
InitializeComponent();
// Set form title
Text = "NOV WinForms - NAreaLabelsExample";
// Create the NOV example and its controls
NWidget exampleContent = CreateExampleContent();
NWidget exampleControls = CreateExampleControls();
if (exampleControls != null)
{
exampleControls.PreferredWidth = 300;
}
// Place the example and its controls in a pair box
NPairBox pairBox = new NPairBox(exampleContent, exampleControls);
pairBox.FillMode = ENStackFillMode.First;
pairBox.FitMode = ENStackFitMode.First;
pairBox.Margins = new NMargins(NDesign.HorizontalSpacing, NDesign.VerticalSpacing);
// Host the example in the form
NNovWidgetHost host = new NNovWidgetHost(pairBox);
host.Dock = DockStyle.Fill;
Controls.Add(host);
}
#endregion
#region Example
public NWidget CreateExampleContent()
{
NChartViewWithCommandBars chartViewWithCommandBars = new NChartViewWithCommandBars();
NChartView chartView = chartViewWithCommandBars.View;
chartView.Surface.CreatePredefinedChart(ENPredefinedChartType.Cartesian);
// configure title
chartView.Surface.Titles[0].Text = "Area Labels";
// configure chart
m_Chart = (NCartesianChart)chartView.Surface.Charts[0];
m_Chart.SetPredefinedCartesianAxes(ENPredefinedCartesianAxis.XYLinear);
// add interlaced stripe for Y axis
NScaleStrip stripStyle = new NScaleStrip(new NColorFill(NColor.Beige), null, true, 0, 0, 1, 1);
stripStyle.Interlaced = true;
NLinearScale scaleY = (NLinearScale)m_Chart.Axes[ENCartesianAxis.PrimaryY].Scale;
scaleY.Strips.Add(stripStyle);
scaleY.MajorGridLines.Visible = true;
m_Area = new NAreaSeries();
m_Chart.Series.Add(m_Area);
// setup area series
m_Area.InflateMargins = true;
m_Area.UseXValues = true;
m_Area.ValueFormatter = new NNumericValueFormatter("0.000");
m_Area.Fill = new NColorFill(NColor.DarkOrange);
m_Area.Stroke = new NStroke(NColor.Black);
NDataLabelStyle dataLabelStyle = new NDataLabelStyle();
dataLabelStyle.Visible = true;
dataLabelStyle.VertAlign = ENVerticalAlignment.Top;
dataLabelStyle.ArrowLength = 20;
dataLabelStyle.ArrowStroke = new NStroke(NColor.Black);
dataLabelStyle.Format = "";
dataLabelStyle.TextStyle.Background.Visible = true;
dataLabelStyle.TextStyle.Background.Padding = new NMargins(0);
m_Area.DataLabelStyle = dataLabelStyle;
// disable initial label positioning
m_Chart.LabelLayout.EnableInitialPositioning = false;
// enable label adjustment
m_Chart.LabelLayout.EnableLabelAdjustment = true;
// enable the data point safesuard and set its size
m_Area.LabelLayout.EnableDataPointSafeguard = true;
m_Area.LabelLayout.DataPointSafeguardSize = new NSize(2,2);
// fill with random data
OnGenerateDataButtonClick(null);
return chartViewWithCommandBars;
}
public NWidget CreateExampleControls()
{
NStackPanel stack = new NStackPanel();
NUniSizeBoxGroup boxGroup = new NUniSizeBoxGroup(stack);
NCheckBox enableLabelAdjustmentCheckBox = new NCheckBox("Enable Label Adjustment");
enableLabelAdjustmentCheckBox.CheckedChanged += OnEnableLabelAdjustmentCheckBoxCheckedChanged;
stack.Add(enableLabelAdjustmentCheckBox);
enableLabelAdjustmentCheckBox.Checked = true;
NCheckBox enableDataPointSafeGuardCheckBox = new NCheckBox("Enable Data Point Safeguard");
enableDataPointSafeGuardCheckBox.CheckedChanged += OnEnableDataPointSafeGuardCheckBoxCheckedChanged;
stack.Add(enableDataPointSafeGuardCheckBox);
enableDataPointSafeGuardCheckBox.Checked = true;
NButton generateDataButton = new NButton("Generate Data");
generateDataButton.Click += OnGenerateDataButtonClick;
stack.Add(generateDataButton);
return boxGroup;
}
public string GetExampleDescription()
{
return @"This example demonstrates how the automatic data label layout works with area data labels.
";
}
///
/// Gets the relevant documentation links for the example
///
///
public (string Name, string Url)[] GetDocumentationUrls()
{
return new[]
{
("Area Series", "https://www.nevron.com/docs/openvision/area-chart-series.html"),
("Series Label Layout", "https://www.nevron.com/docs/openvision/chart-series-label-layout.html"),
("Series Labels Appearance", "https://www.nevron.com/docs/openvision/chart-series-labels-appearance.html"),
("Label Formatting", "https://www.nevron.com/docs/openvision/chart-label-formatting.html"),
};
}
#endregion
#region Implementation
#endregion
#region Event Handlers
void OnEnableLabelAdjustmentCheckBoxCheckedChanged(NValueChangeEventArgs arg)
{
m_Chart.LabelLayout.EnableLabelAdjustment = ((NCheckBox)arg.TargetNode).Checked;
}
void OnEnableDataPointSafeGuardCheckBoxCheckedChanged(NValueChangeEventArgs arg)
{
m_Area.LabelLayout.EnableDataPointSafeguard = ((NCheckBox)arg.TargetNode).Checked;
}
void OnGenerateDataButtonClick(NEventArgs arg)
{
m_Area.DataPoints.Clear();
double xvalue = 10;
Random random = new Random();
for (int i = 0; i < 24; i++)
{
double value = Math.Sin(i * 0.4) * 5 + random.NextDouble() * 3;
xvalue += 1 + random.NextDouble() * 20;
m_Area.DataPoints.Add(new NAreaDataPoint(xvalue, value));
}
}
#endregion
#region Fields
NCartesianChart m_Chart;
NAreaSeries m_Area;
#endregion
#region Static Methods
#endregion
#region Constants
#endregion
#region Nested Types
#endregion
}
}