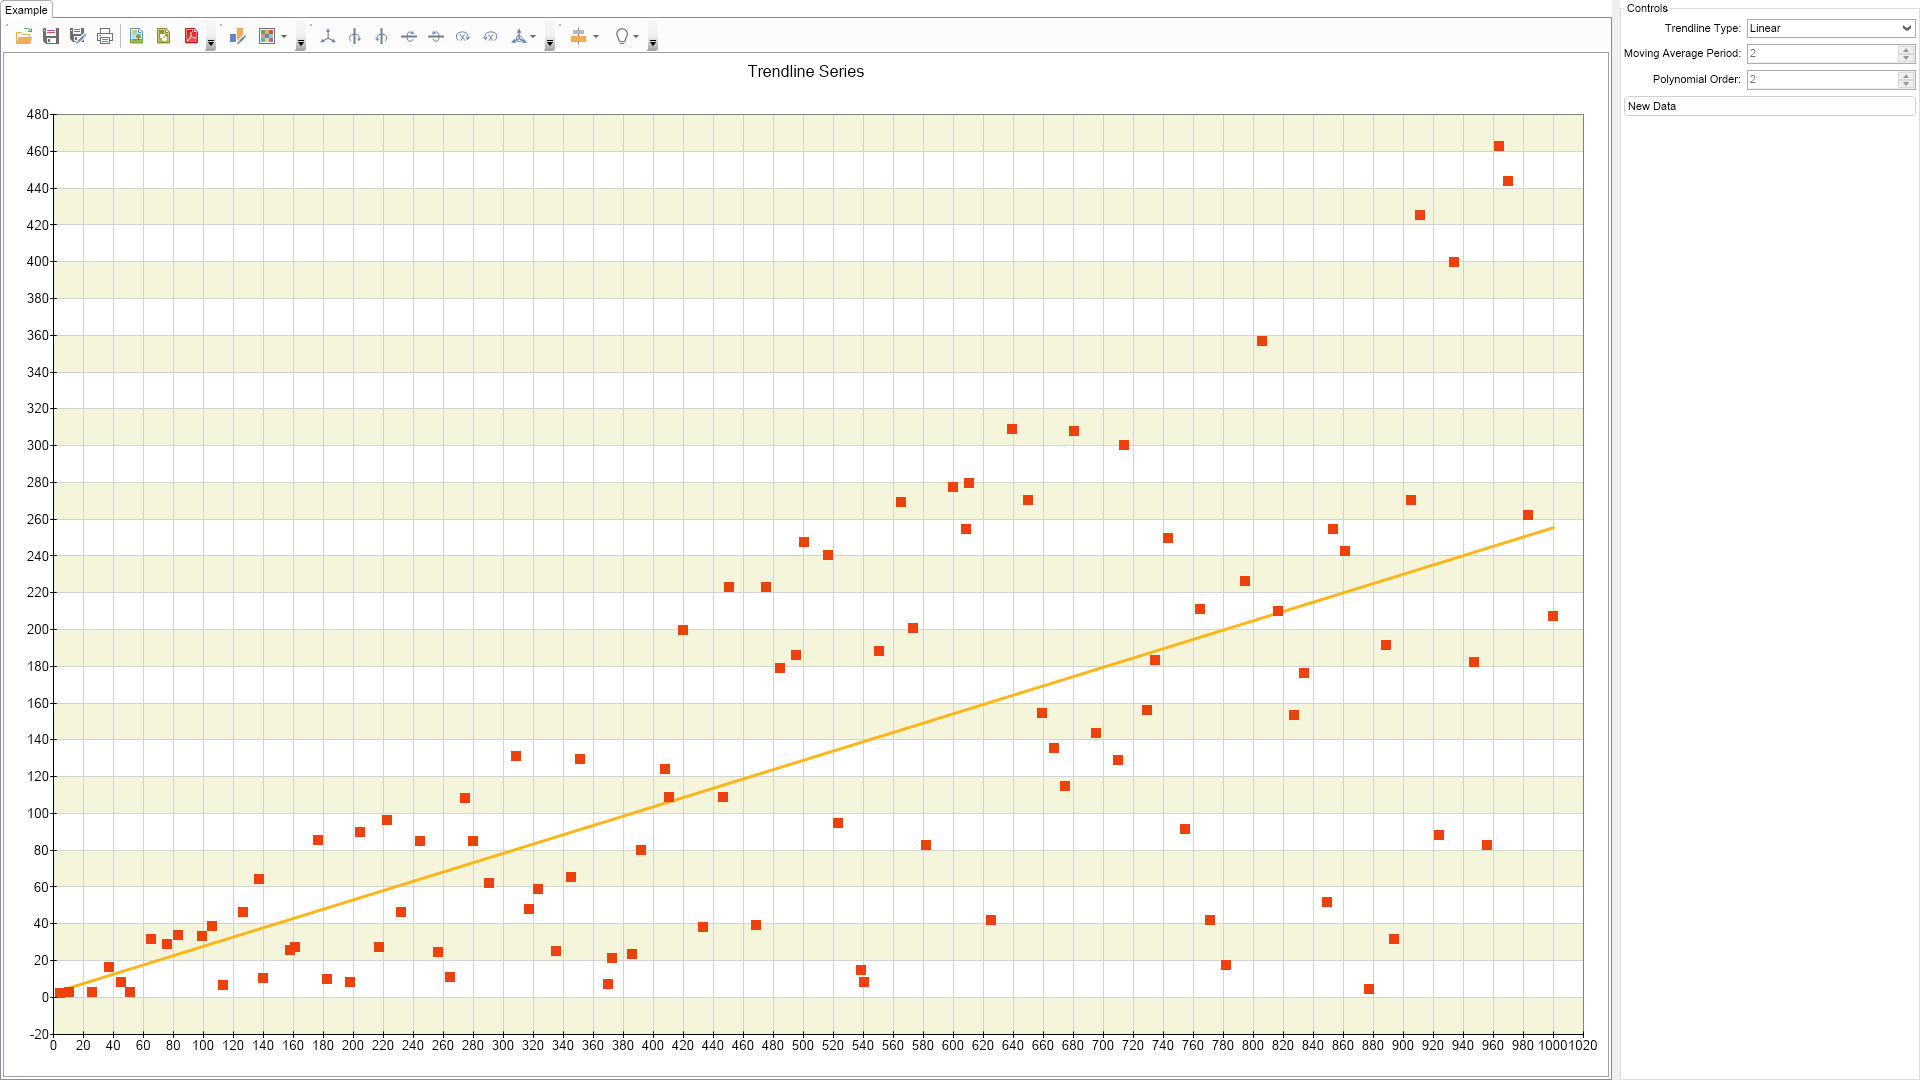
Curve fitting is the process of constructing a curve, or mathematical function, that has the best fit to a series of data points. In this example, the trendline series is used to display different fittings like linear, exponential, logarithmic, etc. of a source data points set.

| Language: C# |
using Nevron.Nov;
using Nevron.Nov.Chart;
using Nevron.Nov.Chart.Tools;
using Nevron.Nov.Dom;
using Nevron.Nov.Graphics;
using Nevron.Nov.Layout;
using Nevron.Nov.UI;
using Nevron.Nov.Windows.Forms;
using System;
using System.Windows.Forms;
namespace NovWinFormsProject
{
public partial class Form1 : Form
{
#region Constructors
public Form1()
{
InitializeComponent();
// Set form title
Text = "NOV WinForms - NTrendlineExample";
// Create the NOV example and its controls
NWidget exampleContent = CreateExampleContent();
NWidget exampleControls = CreateExampleControls();
if (exampleControls != null)
{
exampleControls.PreferredWidth = 300;
}
// Place the example and its controls in a pair box
NPairBox pairBox = new NPairBox(exampleContent, exampleControls);
pairBox.FillMode = ENStackFillMode.First;
pairBox.FitMode = ENStackFitMode.First;
pairBox.Margins = new NMargins(NDesign.HorizontalSpacing, NDesign.VerticalSpacing);
// Host the example in the form
NNovWidgetHost host = new NNovWidgetHost(pairBox);
host.Dock = DockStyle.Fill;
Controls.Add(host);
}
#endregion
#region Example
public NWidget CreateExampleContent()
{
NChartViewWithCommandBars chartViewWithCommandBars = new NChartViewWithCommandBars();
NChartView chartView = chartViewWithCommandBars.View;
chartView.Surface.CreatePredefinedChart(ENPredefinedChartType.Cartesian);
// configure title
chartView.Surface.Titles[0].Text = "Trendline Series";
chartView.Surface.Legends[0].Visibility = ENVisibility.Collapsed;
// configure chart
m_Chart = (NCartesianChart)chartView.Surface.Charts[0];
m_Chart.SetPredefinedCartesianAxes(ENPredefinedCartesianAxis.Standard);
m_Chart.Interactor = new NInteractor(new NTrackballTool());
// switch X axis in linear scale
m_Chart.Axes[ENCartesianAxis.PrimaryX].Scale = new NLinearScale();
// add interlace stripe
NLinearScale linearScale = m_Chart.Axes[ENCartesianAxis.PrimaryY].Scale as NLinearScale;
NScaleStrip strip = new NScaleStrip(new NColorFill(ENNamedColor.Beige), null, true, 0, 0, 1, 1);
strip.Interlaced = true;
linearScale.Strips.Add(strip);
// setup line series to show trenline
m_Trendline = new NTrendlineSeries();
m_Trendline.Name = "Trendline Series";
m_Trendline.Stroke = new NStroke(3, LineColor);
m_Chart.Series.Add(m_Trendline);
m_Trendline.LegendView.Mode = ENSeriesLegendMode.SeriesLogic;
// setup point series to show XY scatter
m_PointSeries = new NPointSeries();
m_PointSeries.Name = "Point Series";
m_PointSeries.UseXValues = true;
m_PointSeries.Fill = new NColorFill(BarColor);
m_Chart.Series.Add(m_PointSeries);
return chartViewWithCommandBars;
}
public NWidget CreateExampleControls()
{
NStackPanel stack = new NStackPanel();
NUniSizeBoxGroup boxGroup = new NUniSizeBoxGroup(stack);
NNumericUpDown movingAveragePeriodNumericUpDown = new NNumericUpDown();
NNumericUpDown polynomialOrderNumericUpDown = new NNumericUpDown();
m_PolynomialOrderNumericUpDown = polynomialOrderNumericUpDown;
m_MovingAveragePeriodNumericUpDown = movingAveragePeriodNumericUpDown;
NComboBox trendlineTypeComboBox = new NComboBox();
trendlineTypeComboBox.Items.FillFromEnum();
trendlineTypeComboBox.SelectedIndexChanged += OnTrendlineTypeComboBoxSelectedIndexChanged;
trendlineTypeComboBox.SelectedIndex = (int)m_Trendline.TrendlineType;
stack.Add(NPairBox.Create("Trendline Type:", trendlineTypeComboBox));
movingAveragePeriodNumericUpDown.Minimum = 1;
movingAveragePeriodNumericUpDown.Maximum = 30;
movingAveragePeriodNumericUpDown.Value = m_Trendline.MovingAveragePeriod;
movingAveragePeriodNumericUpDown.ValueChanged += OnMovingAveragePeriodNumericUpDownValueChanged;
stack.Add(NPairBox.Create("Moving Average Period:", movingAveragePeriodNumericUpDown));
polynomialOrderNumericUpDown.Minimum = 1;
polynomialOrderNumericUpDown.Maximum = 100;
polynomialOrderNumericUpDown.Value = m_Trendline.PolynomialOrder;
polynomialOrderNumericUpDown.ValueChanged += OnPolynomialOrderNumericUpDownValueChanged;
stack.Add(NPairBox.Create("Polynomial Order:", polynomialOrderNumericUpDown));
// new positive data button
NButton newDataButton = new NButton("New Data");
newDataButton.Click += (e) =>
{
// fill with random data
RandomData();
};
stack.Add(newDataButton);
// fill with random data
RandomData();
return boxGroup;
}
public string GetExampleDescription()
{
return @"Curve fitting is the process of constructing a curve, or mathematical function, that has the best fit to a series of data points. In this example, the trendline series is used to
display different fittings like linear, exponential, logarithmic, etc. of a source data points set.
";
}
///
/// Gets the relevant documentation links for the example
///
///
public (string Name, string Url)[] GetDocumentationUrls()
{
return new[]
{
("Trendline Series", "https://www.nevron.com/docs/openvision/trendline-chart-series.html"),
("Common Series Functionality", "https://www.nevron.com/docs/openvision/chart-common-series-functionality.html"),
};
}
#endregion
#region Implementation
private void RandomData()
{
Random rand = new Random();
int count = 100;
double[] randomDataX = new double[count];
double[] randomDataY = new double[count];
double x;
for (int i = 0; i < count; i++)
{
x = i + rand.NextDouble();
randomDataX[i] = x * 10;
randomDataY[i] = x * 5.0 * rand.NextDouble() + rand.NextDouble();
}
m_PointSeries.DataPoints.Clear();
for (int i = 0; i < randomDataX.Length; i++)
{
m_PointSeries.DataPoints.Add(new NPointDataPoint(randomDataX[i], randomDataY[i]));
}
CalculateStatistics();
}
void CalculateStatistics()
{
// show trendline
m_Trendline.SourceSeries = m_PointSeries;
}
private NColor BarColor
{
get
{
return NChartPalette.FreshPalette[0];
}
}
private NColor LineColor
{
get
{
return NChartPalette.FreshPalette[1];
}
}
#endregion
#region Event Handlers
#endregion
#region Fields
NPointSeries m_PointSeries;
NCartesianChart m_Chart;
NTrendlineSeries m_Trendline;
NNumericUpDown m_PolynomialOrderNumericUpDown;
NNumericUpDown m_MovingAveragePeriodNumericUpDown;
#endregion
#region Static Methods
#endregion
#region Constants
#endregion
#region Nested Types
#endregion
}
}