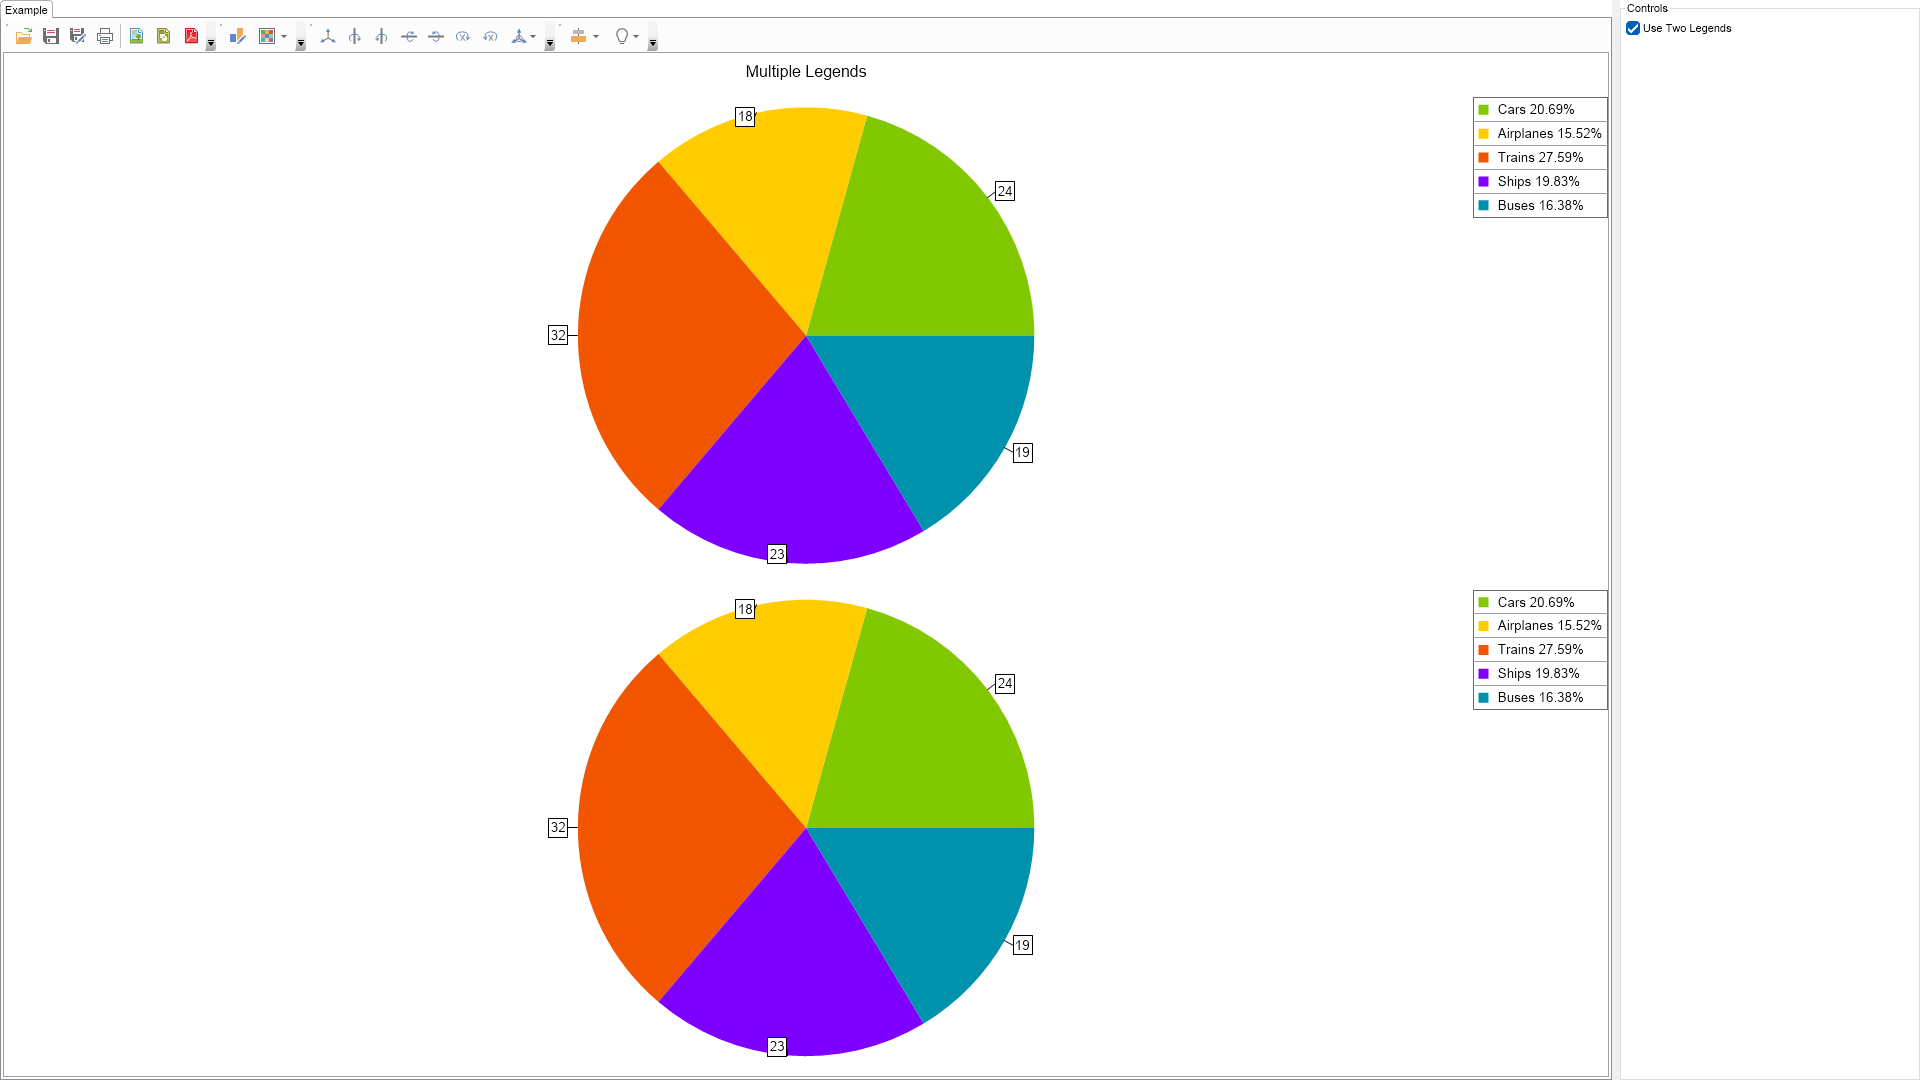
This example demonstrates how to display series data on different legends.

| Language: C# |
using Nevron.Nov;
using Nevron.Nov.Chart;
using Nevron.Nov.Dom;
using Nevron.Nov.Graphics;
using Nevron.Nov.Layout;
using Nevron.Nov.UI;
using Nevron.Nov.Windows.Forms;
using System.Windows.Forms;
namespace NovWinFormsProject
{
public partial class Form1 : Form
{
#region Constructors
public Form1()
{
InitializeComponent();
// Set form title
Text = "NOV WinForms - NMultipleLegendsExample";
// Create the NOV example and its controls
NWidget exampleContent = CreateExampleContent();
NWidget exampleControls = CreateExampleControls();
if (exampleControls != null)
{
exampleControls.PreferredWidth = 300;
}
// Place the example and its controls in a pair box
NPairBox pairBox = new NPairBox(exampleContent, exampleControls);
pairBox.FillMode = ENStackFillMode.First;
pairBox.FitMode = ENStackFitMode.First;
pairBox.Margins = new NMargins(NDesign.HorizontalSpacing, NDesign.VerticalSpacing);
// Host the example in the form
NNovWidgetHost host = new NNovWidgetHost(pairBox);
host.Dock = DockStyle.Fill;
Controls.Add(host);
}
#endregion
#region Example
public NWidget CreateExampleContent()
{
NChartViewWithCommandBars chartViewWithCommandBars = new NChartViewWithCommandBars();
m_ChartView = chartViewWithCommandBars.View;
NDockPanel dockPanel = new NDockPanel();
m_ChartView.Surface.Content = dockPanel;
NLabel label = new NLabel();
label.Margins = new NMargins(10);
label.Font = new NFont(NFontDescriptor.DefaultSansFamilyName, 12);
label.TextFill = new NColorFill(NColor.Black);
label.TextAlignment = ENContentAlignment.MiddleCenter;
label.Text = "Multiple Legends";
NDockLayout.SetDockArea(label, ENDockArea.Top);
dockPanel.AddChild(label);
// stack panel holding content
NStackPanel stackPanel = new NStackPanel();
stackPanel.UniformHeights = ENUniformSize.Max;
stackPanel.FillMode = ENStackFillMode.Equal;
stackPanel.FitMode = ENStackFitMode.Equal;
NDockLayout.SetDockArea(stackPanel, ENDockArea.Center);
dockPanel.AddChild(stackPanel);
// first group of pie + legend
NDockPanel firstGroupPanel = new NDockPanel();
stackPanel.AddChild(firstGroupPanel);
m_PieChart1 = CreatePieChart();
m_Legend1 = CreateLegend();
m_PieChart1.Legend = m_Legend1;
firstGroupPanel.AddChild(m_Legend1);
firstGroupPanel.AddChild(m_PieChart1);
// second group of pie + legend
NDockPanel secondGroupPanel = new NDockPanel();
stackPanel.AddChild(secondGroupPanel);
// setup the volume chart
m_PieChart2 = CreatePieChart();
m_Legend2 = CreateLegend();
m_PieChart2.Legend = m_Legend2;
secondGroupPanel.AddChild(m_Legend2);
secondGroupPanel.AddChild(m_PieChart2);
m_ChartView.Document.StyleSheets.ApplyTheme(new NChartTheme(ENChartPalette.Bright, ENChartPaletteTarget.DataPoints));
return chartViewWithCommandBars;
}
public NWidget CreateExampleControls()
{
NStackPanel stack = new NStackPanel();
NUniSizeBoxGroup boxGroup = new NUniSizeBoxGroup(stack);
NCheckBox useTwoLegendsCheckBox = new NCheckBox("Use Two Legends");
useTwoLegendsCheckBox.Checked = true;
useTwoLegendsCheckBox.CheckedChanged += OnUseTwoLegendsCheckBoxCheckedChanged;
stack.Add(useTwoLegendsCheckBox);
return boxGroup;
}
public string GetExampleDescription()
{
return @"This example demonstrates how to display series data on different legends.
";
}
///
/// Gets the relevant documentation links for the example
///
///
public (string Name, string Url)[] GetDocumentationUrls()
{
return new[]
{
("Legend Layout", "https://www.nevron.com/docs/openvision/chart-legend-layout.html"),
("Overview", "https://www.nevron.com/docs/openvision/chart-legeng-overview.html"),
};
}
#endregion
#region Implementation
private NLegend CreateLegend()
{
NLegend legend = new NLegend();
NDockLayout.SetDockArea(legend, ENDockArea.Center);
legend.HorizontalPlacement = ENHorizontalPlacement.Right;
legend.VerticalPlacement = ENVerticalPlacement.Top;
return legend;
}
private NPieChart CreatePieChart()
{
NPieChart pieChart = new NPieChart();
NDockLayout.SetDockArea(pieChart, ENDockArea.Center);
pieChart.Margins = new NMargins(10, 0, 10, 10);
NPieSeries pieSeries = new NPieSeries();
pieChart.Series.Add(pieSeries);
pieChart.DockSpiderLabelsToSides = false;
NDataLabelStyle dataLabelStyle = new NDataLabelStyle();
dataLabelStyle.ArrowLength = 15;
dataLabelStyle.ArrowPointerLength = 0;
pieSeries.DataLabelStyle = dataLabelStyle;
pieSeries.LabelMode = ENPieLabelMode.Spider;
pieSeries.LegendView.Mode = ENSeriesLegendMode.DataPoints;
pieSeries.LegendView.Format = "