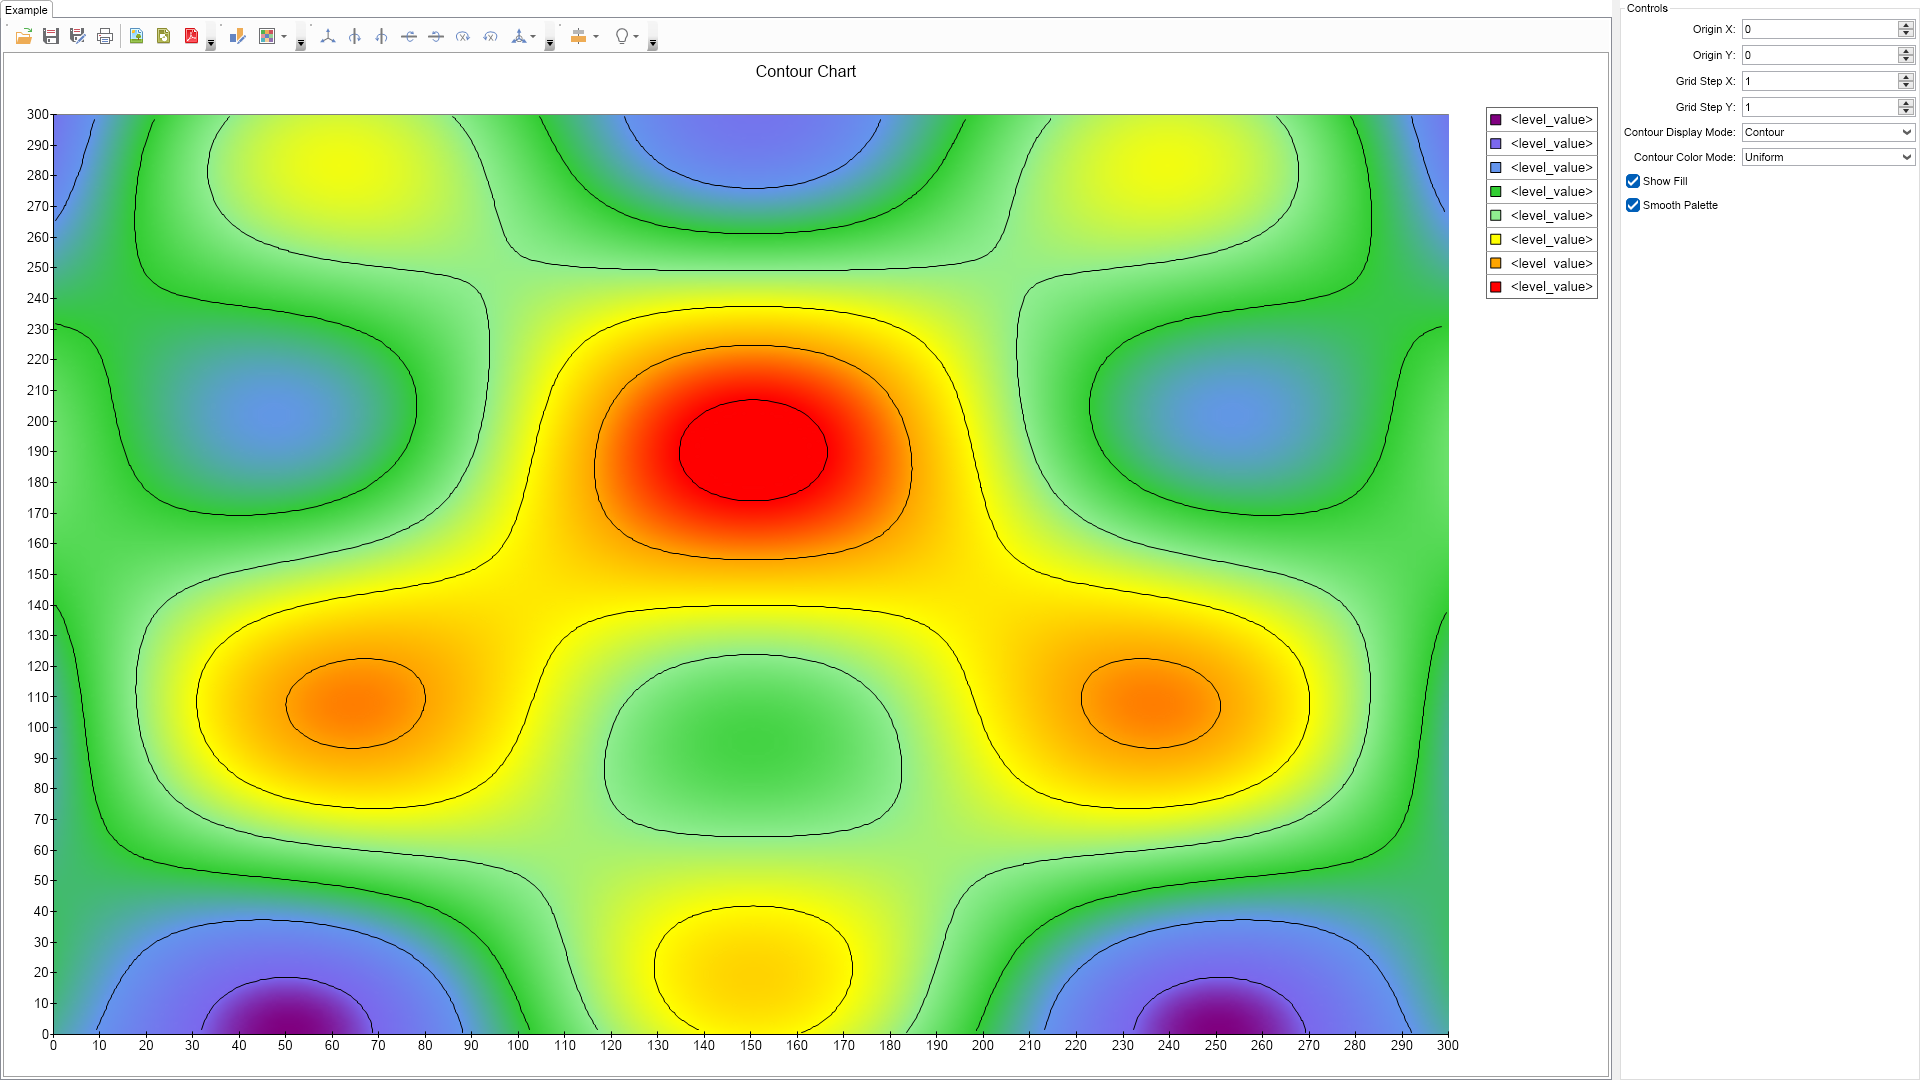
using Nevron.Nov;
using Nevron.Nov.Chart;
using Nevron.Nov.Dom;
using Nevron.Nov.Graphics;
using Nevron.Nov.Layout;
using Nevron.Nov.UI;
using Nevron.Nov.Windows.Forms;
using System;
using System.Windows.Forms;
namespace NovWinFormsProject
{
public partial class Form1 : Form
{
#region Constructors
public Form1()
{
InitializeComponent();
// Set form title
Text = "NOV WinForms - NContourChartExample";
// Create the NOV example and its controls
NWidget exampleContent = CreateExampleContent();
NWidget exampleControls = CreateExampleControls();
if (exampleControls != null)
{
exampleControls.PreferredWidth = 300;
}
// Place the example and its controls in a pair box
NPairBox pairBox = new NPairBox(exampleContent, exampleControls);
pairBox.FillMode = ENStackFillMode.First;
pairBox.FitMode = ENStackFitMode.First;
pairBox.Margins = new NMargins(NDesign.HorizontalSpacing, NDesign.VerticalSpacing);
// Host the example in the form
NNovWidgetHost host = new NNovWidgetHost(pairBox);
host.Dock = DockStyle.Fill;
Controls.Add(host);
}
#endregion
#region Example
public NWidget CreateExampleContent()
{
NChartViewWithCommandBars chartViewWithCommandBars = new NChartViewWithCommandBars();
NChartView chartView = chartViewWithCommandBars.View;
chartView.Surface.CreatePredefinedChart(ENPredefinedChartType.Cartesian);
// configure title
chartView.Surface.Titles[0].Text = "Contour Chart";
// configure chart
NCartesianChart chart = (NCartesianChart)chartView.Surface.Charts[0];
chart.SetPredefinedCartesianAxes(ENPredefinedCartesianAxis.XYLinear);
m_HeatMap = new NHeatMapSeries();
chart.Series.Add(m_HeatMap);
m_HeatMap.Palette = new NColorValuePalette(new NColorValuePair[] { new NColorValuePair(0.0, NColor.Purple),
new NColorValuePair(1.5, NColor.MediumSlateBlue),
new NColorValuePair(3.0, NColor.CornflowerBlue),
new NColorValuePair(4.5, NColor.LimeGreen),
new NColorValuePair(6.0, NColor.LightGreen),
new NColorValuePair(7.5, NColor.Yellow),
new NColorValuePair(9.0, NColor.Orange),
new NColorValuePair(10.5, NColor.Red) });
/* m_HeatMap.Palette = new NColorValuePalette(new NColorValuePair[] { new NColorValuePair(-5.0, NColor.Purple),
new NColorValuePair(1, NColor.MediumSlateBlue),
new NColorValuePair(10.0, NColor.CornflowerBlue) });*/
m_HeatMap.ContourDisplayMode = ENContourDisplayMode.Contour;
m_HeatMap.LegendView.Mode = ENSeriesLegendMode.SeriesLogic;
m_HeatMap.LegendView.Format = "";
GenerateData();
return chartViewWithCommandBars;
}
public NWidget CreateExampleControls()
{
NStackPanel stack = new NStackPanel();
NUniSizeBoxGroup boxGroup = new NUniSizeBoxGroup(stack);
NNumericUpDown originXUpDown = new NNumericUpDown();
originXUpDown.ValueChanged += OnOriginXUpDownValueChanged;
originXUpDown.Value = 0;
stack.Add(NPairBox.Create("Origin X:", originXUpDown));
NNumericUpDown originYUpDown = new NNumericUpDown();
originYUpDown.ValueChanged += OnOriginYUpDownValueChanged;
originYUpDown.Value = 0;
stack.Add(NPairBox.Create("Origin Y:", originYUpDown));
NNumericUpDown GridStepXUpDown = new NNumericUpDown();
GridStepXUpDown.ValueChanged += OnGridStepXUpDownValueChanged;
GridStepXUpDown.Value = 1.0;
stack.Add(NPairBox.Create("Grid Step X:", GridStepXUpDown));
NNumericUpDown GridStepYUpDown = new NNumericUpDown();
GridStepYUpDown.ValueChanged += OnGridStepYUpDownValueChanged;
GridStepYUpDown.Value = 1.0;
stack.Add(NPairBox.Create("Grid Step Y:", GridStepYUpDown));
NComboBox contourDisplayModeCombo = new NComboBox();
contourDisplayModeCombo.Items.FillFromEnum();
contourDisplayModeCombo.SelectedIndexChanged += OnContourDisplayModeComboSelectedIndexChanged;
contourDisplayModeCombo.SelectedIndex = (int)ENContourDisplayMode.Contour;
stack.Add(NPairBox.Create("Contour Display Mode:", contourDisplayModeCombo));
NComboBox contourColorModeCombo = new NComboBox();
contourColorModeCombo.Items.FillFromEnum();
contourColorModeCombo.SelectedIndexChanged += OnContourColorModeComboSelectedIndexChanged;
contourColorModeCombo.SelectedIndex = (int)ENContourColorMode.Uniform;
stack.Add(NPairBox.Create("Contour Color Mode:", contourColorModeCombo));
NCheckBox showFillCheckBox = new NCheckBox("Show Fill");
showFillCheckBox.CheckedChanged += OnShowFillCheckBoxCheckedChanged;
showFillCheckBox.Checked = true;
stack.Add(showFillCheckBox);
NCheckBox smoothPaletteCheckBox = new NCheckBox("Smooth Palette");
smoothPaletteCheckBox.CheckedChanged += OnSmoothPaletteCheckBoxCheckedChanged;
smoothPaletteCheckBox.Checked = true;
stack.Add(smoothPaletteCheckBox);
return boxGroup;
}
public string GetExampleDescription()
{
return @"This example demonstrates how to create a contour chart.
";
}
///
/// Gets the relevant documentation links for the example
///
///
public (string Name, string Url)[] GetDocumentationUrls()
{
return new[]
{
("Heat Map Series", "https://www.nevron.com/docs/openvision/heat-map-chart-series.html"),
("Common Series Functionality", "https://www.nevron.com/docs/openvision/chart-common-series-functionality.html"),
("chart-palettes", "https://www.nevron.com/docs/openvision/chart-palettes.html"),
("Overview", "https://www.nevron.com/docs/openvision/chart-legeng-overview.html"),
};
}
#endregion
#region Implementation
/* private void GenerateData()
{
NGridData data = m_HeatMap.Data;
int GridStepX = 10;
int GridStepY = 10;
data.Size = new NSizeI(GridStepX, GridStepY);
for (int row = 0; row < GridStepX; row++)
{
for (int col = 0; col < GridStepY; col++)
{
int dx = 2 - row;
int dy = 2 - col;
double distance = Math.Sqrt(dx * dx + dy * dy);
data.SetValue(row, col, 5 - distance);
}
}
}*/
private void GenerateData()
{
NHeatMapData data = m_HeatMap.Data;
int GridStepX = 300;
int GridStepY = 300;
data.Size = new NSizeI(GridStepX, GridStepY);
const double dIntervalX = 10.0;
const double dIntervalZ = 10.0;
double dIncrementX = (dIntervalX / GridStepX);
double dIncrementZ = (dIntervalZ / GridStepY);
double y, x, z;
z = -(dIntervalZ / 2);
for (int col = 0; col < GridStepX; col++, z += dIncrementZ)
{
x = -(dIntervalX / 2);
for (int row = 0; row < GridStepY; row++, x += dIncrementX)
{
y = 10 - Math.Sqrt((x * x) + (z * z) + 2);
y += 3.0 * Math.Sin(x) * Math.Cos(z);
data.SetValue(row, col, y);
}
}
}
#endregion
#region Event Handlers
void OnOriginYUpDownValueChanged(NValueChangeEventArgs arg)
{
m_HeatMap.Data.OriginY = ((NNumericUpDown)arg.TargetNode).Value;
}
void OnOriginXUpDownValueChanged(NValueChangeEventArgs arg)
{
m_HeatMap.Data.OriginX = ((NNumericUpDown)arg.TargetNode).Value;
}
void OnGridStepYUpDownValueChanged(NValueChangeEventArgs arg)
{
m_HeatMap.Data.StepY = ((NNumericUpDown)arg.TargetNode).Value;
}
void OnGridStepXUpDownValueChanged(NValueChangeEventArgs arg)
{
m_HeatMap.Data.StepX = ((NNumericUpDown)arg.TargetNode).Value;
}
void OnShowFillCheckBoxCheckedChanged(NValueChangeEventArgs arg)
{
m_HeatMap.ShowFill = ((NCheckBox)arg.TargetNode).Checked;
}
void OnContourColorModeComboSelectedIndexChanged(NValueChangeEventArgs arg)
{
m_HeatMap.ContourColorMode = (ENContourColorMode)((NComboBox)arg.TargetNode).SelectedIndex;
}
void OnContourDisplayModeComboSelectedIndexChanged(NValueChangeEventArgs arg)
{
m_HeatMap.ContourDisplayMode = (ENContourDisplayMode)((NComboBox)arg.TargetNode).SelectedIndex;
}
void OnSmoothPaletteCheckBoxCheckedChanged(NValueChangeEventArgs arg)
{
m_HeatMap.Palette.InterpolateColors = ((NCheckBox)arg.TargetNode).Checked;
}
#endregion
#region Fields
NHeatMapSeries m_HeatMap;
#endregion
#region Static Methods
#endregion
#region Constants
#endregion
#region Nested Types
#endregion
}
}

 Chart for .NET
 Diagram for .NET
 User Interface for .NET
 Vision for SSRS
 Chart for SSRS
 Gauge for SSRS
 Map for SSRS
 Barcode for SSRS
 Vision for SharePoint
 Chart for SharePoint
 Gauge for SharePoint
 Map for SharePoint
 Barcode for SharePoint
 Open Vision for .NET


 Vision for .NET