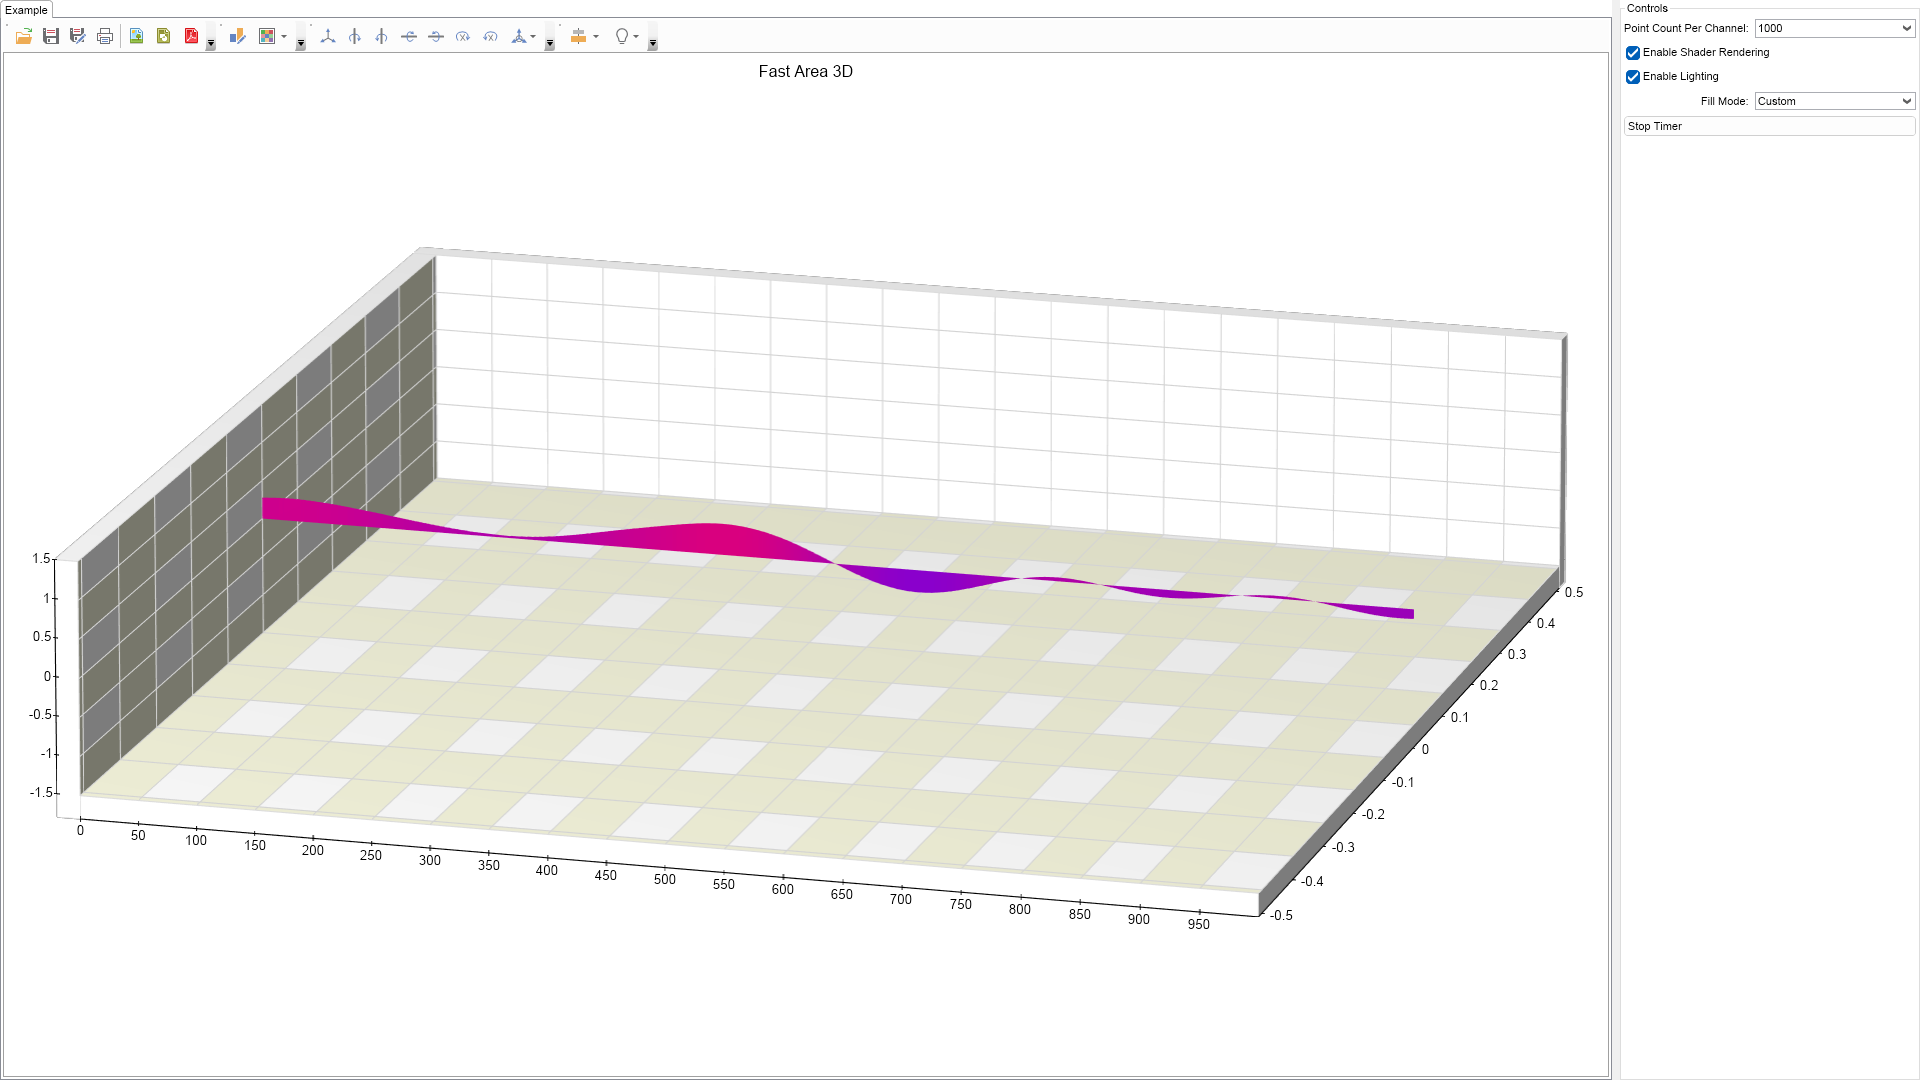
using Nevron.Nov;
using Nevron.Nov.Chart;
using Nevron.Nov.Chart.Tools;
using Nevron.Nov.Dom;
using Nevron.Nov.Graphics;
using Nevron.Nov.Layout;
using Nevron.Nov.UI;
using Nevron.Nov.Windows.Forms;
using System;
using System.Windows.Forms;
namespace NovWinFormsProject
{
public partial class Form1 : Form
{
#region Constructors
public Form1()
{
InitializeComponent();
// Set form title
Text = "NOV WinForms - NFastArea3D";
// Create the NOV example and its controls
NWidget exampleContent = CreateExampleContent();
NWidget exampleControls = CreateExampleControls();
if (exampleControls != null)
{
exampleControls.PreferredWidth = 300;
}
// Place the example and its controls in a pair box
NPairBox pairBox = new NPairBox(exampleContent, exampleControls);
pairBox.FillMode = ENStackFillMode.First;
pairBox.FitMode = ENStackFitMode.First;
pairBox.Margins = new NMargins(NDesign.HorizontalSpacing, NDesign.VerticalSpacing);
// Host the example in the form
NNovWidgetHost host = new NNovWidgetHost(pairBox);
host.Dock = DockStyle.Fill;
Controls.Add(host);
}
#endregion
#region Example
///
/// Represents a fast point series
///
class NPulsePoint
{
public double X;
public double Y;
public double Intensity;
public double WaveLength;
public double Phase;
public double PhaseStep;
public double PhaseSin;
};
///
///
///
///
public NWidget CreateExampleContent()
{
NChartViewWithCommandBars chartViewWithCommandBars = new NChartViewWithCommandBars();
NChartView chartView = chartViewWithCommandBars.View;
chartView.Surface.CreatePredefinedChart(ENPredefinedChartType.Cartesian);
chartView.Registered += OnChartViewRegistered;
chartView.Unregistered += OnChartViewUnregistered;
m_Title = chartView.Surface.Titles[0];
m_Title.Text = "Fast Area 3D";
// configure the chart
m_Chart = (NCartesianChart)chartView.Surface.Charts[0];
m_Chart.Enable3D = true;
m_Chart.ModelWidth = 50;
m_Chart.ModelHeight = 50;
m_Chart.ModelDepth = 50;
m_Chart.Projection.SetPredefinedProjection(ENPredefinedProjection.Perspective1);
m_Chart.LightModel.SetPredefinedLightModel(ENPredefinedLightModel.SoftTopRight);
m_Chart.Interactor = new NInteractor(new NTrackballTool());
m_Chart.ModelWidth = 50;
m_Chart.ModelHeight = 10;
m_Chart.ModelDepth = 50;
// precalculate sinus table
for (int i = 0; i < 360; i++)
{
m_SinTable[i] = Math.Sin(i * Math.PI / 180);
}
m_Chart.Axes[ENCartesianAxis.PrimaryY].SetFixedViewRange(new NRange(-1.5, 1.5));
ConfigureLinearScale(m_Chart.Axes[ENCartesianAxis.PrimaryX]);
ConfigureLinearScale(m_Chart.Axes[ENCartesianAxis.PrimaryY]);
ConfigureLinearScale(m_Chart.Axes[ENCartesianAxis.Depth]);
// assign a palette to the axis scale so that all series in the chart can scale using the same palette
m_Chart.Axes[ENCartesianAxis.PrimaryY].Scale.Ruler.Palette = new NRangeMultiColorPalette();
return chartViewWithCommandBars;
}
///
///
///
///
public NWidget CreateExampleControls()
{
NStackPanel stack = new NStackPanel();
NUniSizeBoxGroup group = new NUniSizeBoxGroup(stack);
m_AreaPointCountComboBox = new NComboBox();
m_AreaPointCountComboBox.Items.Add(new NComboBoxItem("1000"));
m_AreaPointCountComboBox.Items.Add(new NComboBoxItem("2000"));
m_AreaPointCountComboBox.Items.Add(new NComboBoxItem("5000"));
m_AreaPointCountComboBox.SelectedIndex = 0;
stack.Add(NPairBox.Create("Point Count Per Channel:", m_AreaPointCountComboBox));
m_EnableShaderRenderingCheckBox = new NCheckBox("Enable Shader Rendering");
m_EnableShaderRenderingCheckBox.CheckedChanged += OnEnableShaderRenderingCheckBoxCheckedChanged;
m_EnableShaderRenderingCheckBox.Checked = true;
stack.Add(m_EnableShaderRenderingCheckBox);
m_EnableLightingCheckBox = new NCheckBox("Enable Lighting");
m_EnableLightingCheckBox.Checked = true;
m_EnableLightingCheckBox.CheckedChanged += OnEnableLightingCheckBoxCheckedChanged;
stack.Add(m_EnableLightingCheckBox);
m_FillModeComboBox = new NComboBox();
m_FillModeComboBox.SelectedIndexChanged += OnFillModeComboBoxSelectedIndexChanged;
m_FillModeComboBox.Items.FillFromEnum();
stack.Add(NPairBox.Create("Fill Mode:", m_FillModeComboBox));
m_FillModeComboBox.SelectedIndex = (int)ENColorMode.Custom;
m_StartStopTimerButton = new NButton("Stop Timer");
m_StartStopTimerButton.Click += OnStartStopTimerButtonClick;
stack.Add(m_StartStopTimerButton);
// make sure max point count is updated
m_AreaPointCountComboBox.SelectedIndexChanged += OnPointCountPerChannelComboBoxSelectedIndexChanged;
OnPointCountPerChannelComboBoxSelectedIndexChanged(null);
return group;
}
///
///
///
///
public string GetExampleDescription()
{
return @"This example demonstrates how to create a 3D fast area series, that renders millions of data points in real-time.
";
}
///
/// Gets the relevant documentation links for the example
///
///
public (string Name, string Url)[] GetDocumentationUrls()
{
return new[]
{
("Fast Area Series", "https://www.nevron.com/docs/openvision/fast-area-chart-series.html"),
("Fast Series Overview", "https://www.nevron.com/docs/openvision/fast-chart-series-overview.html"),
("3D Charts", "https://www.nevron.com/docs/openvision/3d-charts.html"),
("Cartesian Axes", "https://www.nevron.com/docs/openvision/cartesian-chart-axes.html"),
("Chart Data Series", "https://www.nevron.com/docs/openvision/chart-data-series.html"),
};
}
#endregion
#region Implementation
///
/// Applies a linear scale and an interlaced stripe at the specified axis
///
///
private void ConfigureLinearScale(NCartesianAxis axis)
{
// add interlaced stripe to the Y axis
NLinearScale scale = new NLinearScale();
NScaleStrip stripStyle = new NScaleStrip(new NColorFill(NColor.Beige), null, true, 0, 0, 1, 1);
stripStyle.SetShowAtWall(ENChartWall.Left, true);
stripStyle.SetShowAtWall(ENChartWall.Back, true);
stripStyle.SetShowAtWall(ENChartWall.Right, true);
stripStyle.SetShowAtWall(ENChartWall.Front, true);
stripStyle.SetShowAtWall(ENChartWall.Bottom, true);
stripStyle.SetShowAtWall(ENChartWall.Top, true);
stripStyle.Interlaced = true;
scale.Strips.Add(stripStyle);
scale.ViewRangeInflateMode = ENScaleViewRangeInflateMode.Logical;
axis.Scale = scale;
}
#endregion
#region Event Handlers
///
///
///
///
private void OnFillModeComboBoxSelectedIndexChanged(NValueChangeEventArgs arg)
{
m_Chart.Series.Clear();
}
///
/// Timer tick
///
private void OnTimerTick()
{
for (int i = 0; i < m_MaxPulsePoints; i++)
{
NPulsePoint pulsePoint = m_PulsePoints[i];
pulsePoint.Phase += pulsePoint.PhaseStep;
pulsePoint.PhaseSin = Math.Sin(pulsePoint.Phase);
}
NFastAreaSeries fastAreaSeries = new NFastAreaSeries();
m_Chart.Series.Add(fastAreaSeries);
fastAreaSeries.Fill = new NColorFill(NColor.Red);
fastAreaSeries.FillColorMode = (ENColorMode)m_FillModeComboBox.SelectedIndex;
if (fastAreaSeries.FillColorMode == ENColorMode.Zone)
{
fastAreaSeries.Palette = new NAxisPalette();
}
fastAreaSeries.Data.SetCount(m_PointCount);
fastAreaSeries.Data.HasXValues = true;
fastAreaSeries.Data.HasColors = ((ENColorMode)m_FillModeComboBox.SelectedIndex == ENColorMode.Custom);
fastAreaSeries.LegendView.Mode = ENSeriesLegendMode.None;
if (m_Chart.Series.Count > 100)
{
m_Chart.Series.RemoveAt(0);
}
// spin the points
unsafe
{
fixed (byte* pData = &fastAreaSeries.Data.Data[0])
{
int pointCount = fastAreaSeries.Data.Count;
int dataItemSize = fastAreaSeries.Data.DataItemSize;
float* pXValues = (float*)fastAreaSeries.Data.GetDataChannelPointer(ENSeriesDataChannelName.XValueF, pData);
float* pYValues = (float*)fastAreaSeries.Data.GetDataChannelPointer(ENSeriesDataChannelName.YValueF, pData);
bool useColor = fastAreaSeries.Data.HasColors;
uint* pColor = null;
if (useColor)
{
pColor = (uint*)fastAreaSeries.Data.GetDataChannelPointer(ENSeriesDataChannelName.Color, pData);
}
NColor color1 = NColor.Blue;
NColor color2 = NColor.Red;
const float value1 = -1.5f;
const float value2 = 1.5f;
float valueDistance = value2 - value1;
int r1 = color1.R;
int g1 = color1.G;
int b1 = color1.B;
int rDiff = (color2.R - color1.R);
int gDiff = (color2.G - color1.G);
int bDiff = (color2.B - color1.B);
NPulsePoint[] pulsePoints = m_PulsePoints;
for (int i = 0; i < pointCount; i++)
{
int row = i / m_PointCount;
int col = i % m_PointCount;
double sum = 0;
float x = col;
float z = row;
for (int j = 0; j < pulsePoints.Length; j++)
{
NPulsePoint pulsePoint = pulsePoints[j];
double dx = pulsePoint.X - row;
double dy = pulsePoint.Y - col;
double distance = Math.Sqrt(dx * dx + dy * dy);
double waveFactor = (distance - (int)(distance / pulsePoint.WaveLength) * pulsePoint.WaveLength) / pulsePoint.WaveLength;
waveFactor = m_SinTable[(int)(waveFactor * 360)];
// waveFactor = 1.0f;
sum += (pulsePoint.Intensity) * waveFactor * pulsePoint.PhaseSin * (1 - Math.Min(1, distance / m_PointCount));
}
*pXValues = i;
*pYValues = Math.Min(2, (float)sum);
// create a color between coor1 and color 2
if (useColor)
{
float factor = Math.Min(1, Math.Max(0, (*pYValues - value1) / valueDistance));
uint r = (uint)(r1 + (int)(rDiff * factor));
uint g = (uint)(g1 + (int)(gDiff * factor));
uint b = (uint)(b1 + (int)(bDiff * factor));
*pColor = (uint)(0xFF000000 | (b << 16) | (g << 8) | r);
}
pXValues += dataItemSize;
pYValues += dataItemSize;
pColor += dataItemSize;
}
}
}
fastAreaSeries.Data.OnDataChanged();
}
///
/// Start / stop timer button
///
///
void OnStartStopTimerButtonClick(NEventArgs args)
{
if (m_Timer.IsStarted)
{
m_Timer.Stop();
m_StartStopTimerButton.Content = new NLabel("Start Timer");
}
else
{
m_Timer.Start();
m_StartStopTimerButton.Content = new NLabel("Stop Timer");
}
}
///
///
///
///
private void OnChartViewRegistered(NEventArgs arg)
{
m_Timer = new NTimer();
m_Timer.Tick += OnTimerTick;
m_Timer.Start();
}
///
///
///
///
private void OnChartViewUnregistered(NEventArgs arg)
{
m_Timer.Stop();
m_Timer.Tick -= OnTimerTick;
m_Timer = null;
}
///
///
///
///
///
private void OnEnableShaderRenderingCheckBoxCheckedChanged(NValueChangeEventArgs arg)
{
NChartViewWithCommandBars chartView = (NChartViewWithCommandBars)ExampleContent;
NChart[] charts = chartView.View.Surface.Charts;
for (int i = 0; i < charts.Length; i++)
{
NCartesianChart chart = (NCartesianChart)charts[i];
for (int j = 0; j < chart.Series.Count; j++)
{
NFastAreaSeries fastArea = chart.Series[j] as NFastAreaSeries;
if (fastArea != null)
{
fastArea.EnableShaderRendering = m_EnableShaderRenderingCheckBox.Checked;
}
}
}
}
///
///
///
///
///
private void OnEnableLightingCheckBoxCheckedChanged(NValueChangeEventArgs arg)
{
NChartViewWithCommandBars chartView = (NChartViewWithCommandBars)ExampleContent;
NChart[] charts = chartView.View.Surface.Charts;
for (int i = 0; i < charts.Length; i++)
{
NCartesianChart chart = (NCartesianChart)charts[i];
chart.LightModel.EnableLighting = m_EnableLightingCheckBox.Checked;
}
}
///
///
///
///
///
private void OnPointCountPerChannelComboBoxSelectedIndexChanged(NValueChangeEventArgs arg)
{
switch (m_AreaPointCountComboBox.SelectedIndex)
{
case 0:
m_PointCount = 1000;
break;
case 1:
m_PointCount = 2000;
break;
case 2:
m_PointCount = 5000;
break;
}
m_Chart.Series.Clear();
m_PulsePoints = new NPulsePoint[m_MaxPulsePoints];
for (int i = 0; i < m_MaxPulsePoints; i++)
{
NPulsePoint pulsePoint = new NPulsePoint();
pulsePoint.X = m_PointCount * m_Random.NextDouble();
pulsePoint.Y = m_PointCount * m_Random.NextDouble();
pulsePoint.Intensity = Math.Max(0.25, m_Random.NextDouble());
pulsePoint.WaveLength = m_Random.NextDouble() * m_PointCount / 4.0;
pulsePoint.Phase = m_Random.NextDouble() * Math.PI * 2;
pulsePoint.PhaseStep = Math.Max(0.2, m_Random.NextDouble()) * Math.PI / 10;
pulsePoint.PhaseSin = Math.Sin(pulsePoint.Phase);
m_PulsePoints[i] = pulsePoint;
}
OnTimerTick();
}
#endregion
#region Fields
Random m_Random = new Random();
const int m_MaxPulsePoints = 5;
double[] m_SinTable = new double[360];
NLabel m_Title;
NCartesianChart m_Chart;
NTimer m_Timer;
int m_PointCount;
NPulsePoint[] m_PulsePoints;
NComboBox m_AreaPointCountComboBox;
NCheckBox m_EnableShaderRenderingCheckBox;
NCheckBox m_EnableLightingCheckBox;
NComboBox m_FillModeComboBox;
NButton m_StartStopTimerButton;
#endregion
#region Static Methods
#endregion
#region Constants
#endregion
#region Nested Types
#endregion
}
}

 Chart for .NET
 Diagram for .NET
 User Interface for .NET
 Vision for SSRS
 Chart for SSRS
 Gauge for SSRS
 Map for SSRS
 Barcode for SSRS
 Vision for SharePoint
 Chart for SharePoint
 Gauge for SharePoint
 Map for SharePoint
 Barcode for SharePoint
 Open Vision for .NET


 Vision for .NET