using Nevron.Nov;
using Nevron.Nov.Chart;
using Nevron.Nov.Dom;
using Nevron.Nov.Graphics;
using Nevron.Nov.Layout;
using Nevron.Nov.UI;
using Nevron.Nov.Windows.Forms;
using System.Windows.Forms;
namespace NovWinFormsProject
{
public partial class Form1 : Form
{
#region Constructors
public Form1()
{
InitializeComponent();
// Set form title
Text = "NOV WinForms - NRangeFillStylesExample";
// Create the NOV example and its controls
NWidget exampleContent = CreateExampleContent();
NWidget exampleControls = CreateExampleControls();
if (exampleControls != null)
{
exampleControls.PreferredWidth = 300;
}
// Place the example and its controls in a pair box
NPairBox pairBox = new NPairBox(exampleContent, exampleControls);
pairBox.FillMode = ENStackFillMode.First;
pairBox.FitMode = ENStackFitMode.First;
pairBox.Margins = new NMargins(NDesign.HorizontalSpacing, NDesign.VerticalSpacing);
// Host the example in the form
NNovWidgetHost host = new NNovWidgetHost(pairBox);
host.Dock = DockStyle.Fill;
Controls.Add(host);
}
#endregion
#region Example
public NWidget CreateExampleContent()
{
NChartViewWithCommandBars chartViewWithCommandBars = new NChartViewWithCommandBars();
NChartView chartView = chartViewWithCommandBars.View;
chartView.Surface.CreatePredefinedChart(ENPredefinedChartType.Cartesian);
// configure title
chartView.Surface.Titles[0].Text = "Tallest Buildings in the World";
// configure chart
NCartesianChart chart = (NCartesianChart)chartView.Surface.Charts[0];
chart.SetPredefinedCartesianAxes(ENPredefinedCartesianAxis.XYLinear);
// setup X axis
NLinearScale xScale = (NLinearScale)chart.Axes[ENCartesianAxis.PrimaryX].Scale;
xScale.Labels.Visible = false;
xScale.InnerMajorTicks.Visible = false;
xScale.OuterMajorTicks.Visible = false;
xScale.ViewRangeInflateMode = ENScaleViewRangeInflateMode.Logical;
xScale.LogicalInflate = new NRange(10, 10);
// setup Y axis
NLinearScale yScale = (NLinearScale)chart.Axes[ENCartesianAxis.PrimaryY].Scale;
yScale.MajorGridLines.Visible = true;
// add interlaced stripe
NScaleStrip strip = new NScaleStrip(new NColorFill(NColor.Beige), null, true, 0, 0, 1, 1);
strip.Interlaced = true;
yScale.Strips.Add(strip);
// setup shape series
NRangeSeries rangeSeries = new NRangeSeries();
chart.Series.Add(rangeSeries);
chart.FitMode = ENCartesianChartFitMode.Aspect;
chart.Aspect = 1;
rangeSeries.DataLabelStyle = new NDataLabelStyle(false);
rangeSeries.UseXValues = true;
rangeSeries.LegendView.Mode = ENSeriesLegendMode.None;
// fill data
string[] buildingNames = new string[] { "Jeddah Tower", "Burj Khalifa", "Abraj Al Bait", "Taipei 101", "Zifeng Tower" };
string[] countryNames = new string[] { "Saudi Arabia", "UAE", "Saudi Arabia", "Taiwan", "China" };
NEmbeddedResource[] buildingSilhouettes = new NEmbeddedResource[] { Nevron.Nov.Examples.NResources.RIMG_Buildings_JeddahTower_emf,
Nevron.Nov.Examples.NResources.RIMG_Buildings_BurjKhalifa_emf,
Nevron.Nov.Examples.NResources.RIMG_Buildings_AbrajAlBait_emf,
Nevron.Nov.Examples.NResources.RIMG_Buildings_Taipei101_emf,
Nevron.Nov.Examples.NResources.RIMG_Buildings_ZifengTower_emf };
NEmbeddedResource[] buildingCountryFlags = new NEmbeddedResource[] { Nevron.Nov.Examples.NResources.RIMG_Buildings_SaudiArabia_emf,
Nevron.Nov.Examples.NResources.RIMG_Buildings_UAE_emf,
Nevron.Nov.Examples.NResources.RIMG_Buildings_SaudiArabia_emf,
Nevron.Nov.Examples.NResources.RIMG_Buildings_Taiwan_emf,
Nevron.Nov.Examples.NResources.RIMG_Buildings_China_emf };
NLegend legend = (NLegend)chartView.Surface.Legends[0];
legend.Mode = ENLegendMode.Custom;
legend.Header = new NLabel("Some of World's Tallest Buildings");
double xOffset = 0;
for (int i = 0; i < buildingNames.Length; i++)
{
NImage buildingImage = NImage.FromNevronResource(buildingSilhouettes[i]);
// add data point
NRangeDataPoint rangeDataPoint = new NRangeDataPoint();
double buildingWidth = buildingImage.Width / 2;
double buildingHeight = buildingImage.Height / 2;
rangeDataPoint.X = xOffset;
rangeDataPoint.X2 = xOffset + buildingWidth;
rangeDataPoint.Y = 0;
rangeDataPoint.Y2 = buildingHeight;
rangeDataPoint.Fill = new NImageFill(buildingImage);
rangeSeries.DataPoints.Add(rangeDataPoint);
NCustomRangeLabel customRangeLabel = new NCustomRangeLabel(new NRange(rangeDataPoint.X, rangeDataPoint.X2), buildingNames[i]);
customRangeLabel.LabelStyle.TickMode = ENRangeLabelTickMode.Separators;
customRangeLabel.LabelStyle.FitMode = ENRangeLabelFitMode.Wrap | ENRangeLabelFitMode.AutoFlip;
xScale.CustomLabels.Add(customRangeLabel);
xOffset += buildingWidth + 10;
// add legend item
NImage buildingCountryFlagImage = NImage.FromNevronResource(buildingCountryFlags[i]);
NImageBox buildingCountryImageBox = new NImageBox(buildingCountryFlagImage);
buildingCountryImageBox.PreferredSize = new NSize(40, 30);
legend.Items.Add(new NPairBox(buildingCountryImageBox, new NLabel(buildingNames[i] + ", " + countryNames[i])));
}
return chartViewWithCommandBars;
}
public NWidget CreateExampleControls()
{
return null;
}
public string GetExampleDescription()
{
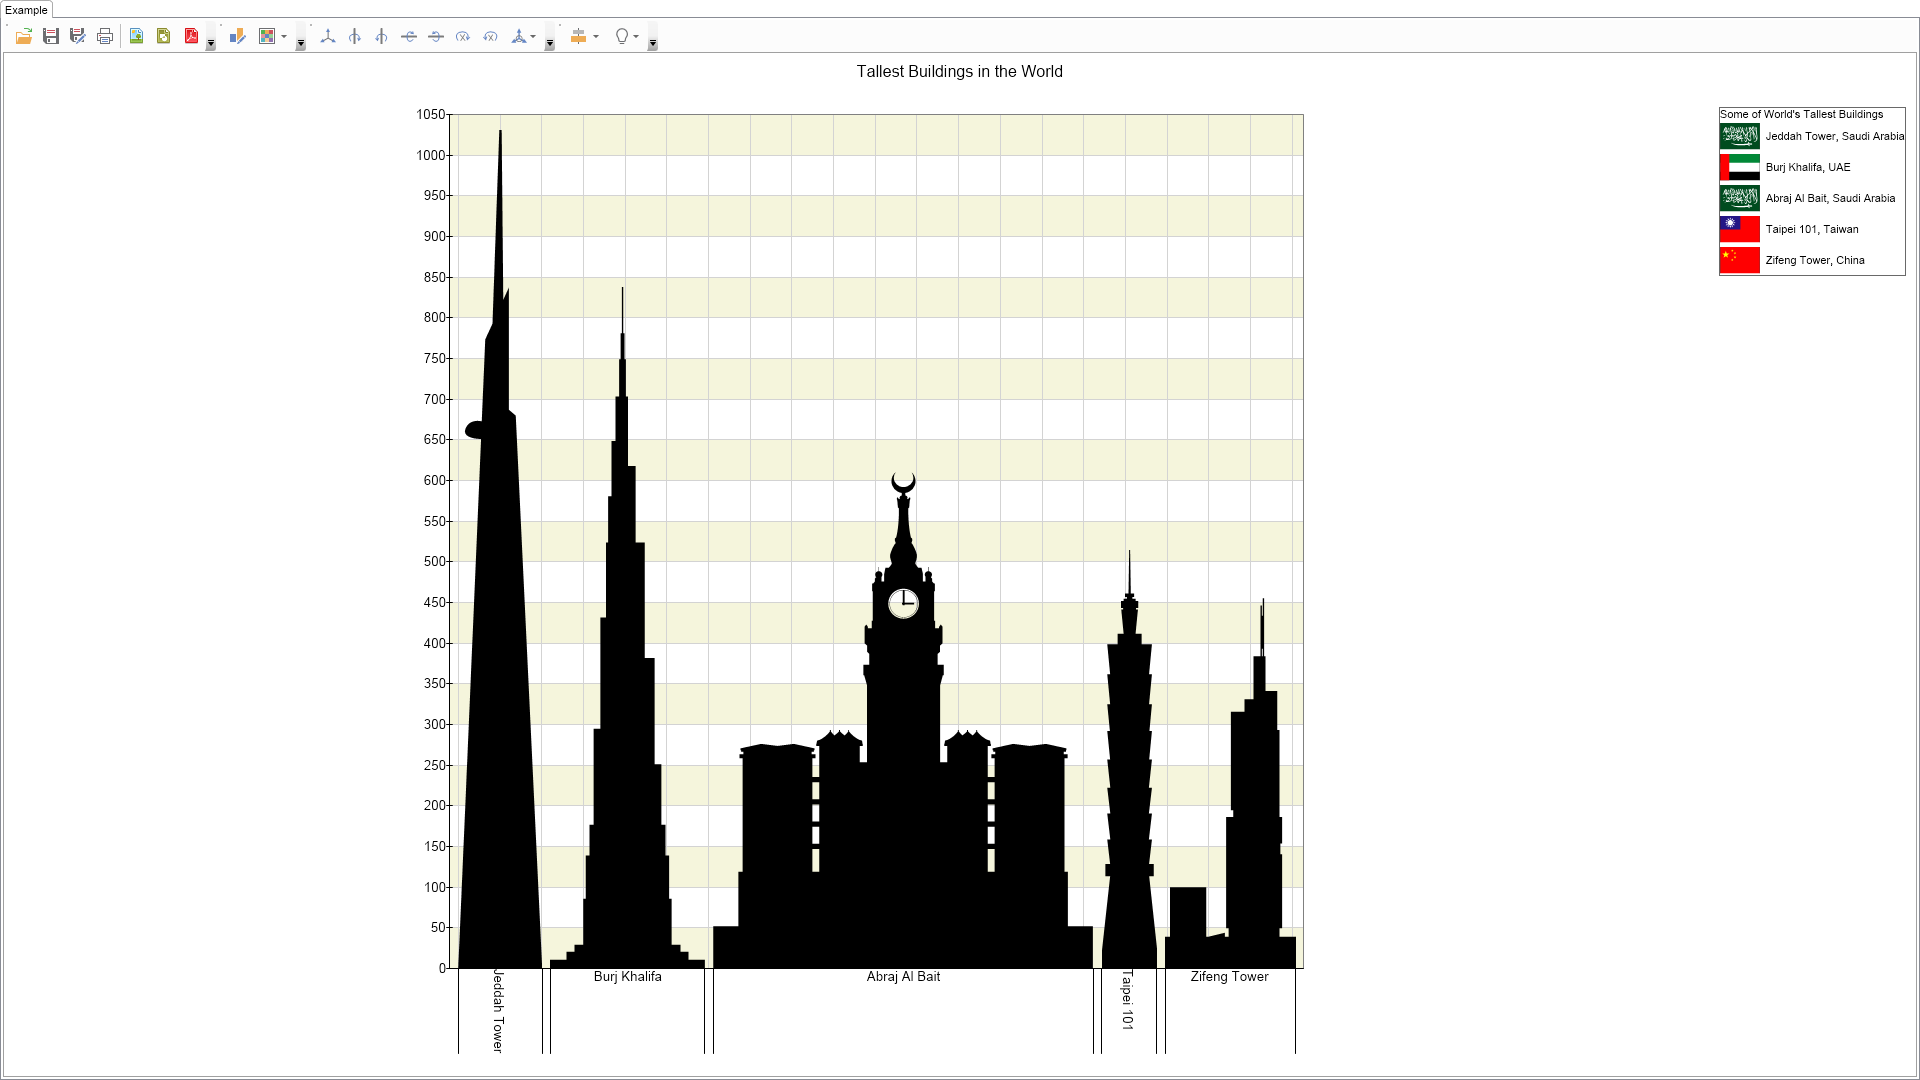
return @"The example demostrates how to apply different fill styles to range elements, as well as the ability of the control to use vector images in WMF, EMF and EMF+ formats.
";
}
///
/// Gets the relevant documentation links for the example
///
///
public (string Name, string Url)[] GetDocumentationUrls()
{
return new[]
{
("Range Series", "https://www.nevron.com/docs/openvision/range-chart-series.html"),
("Common Series Functionality", "https://www.nevron.com/docs/openvision/chart-common-series-functionality.html"),
};
}
#endregion
#region Implementation
#endregion
#region Event Handlers
#endregion
#region Fields
#endregion
#region Static Methods
#endregion
#region Constants
#endregion
#region Nested Types
#endregion
}
}

 Chart for .NET
 Diagram for .NET
 User Interface for .NET
 Vision for SSRS
 Chart for SSRS
 Gauge for SSRS
 Map for SSRS
 Barcode for SSRS
 Vision for SharePoint
 Chart for SharePoint
 Gauge for SharePoint
 Map for SharePoint
 Barcode for SharePoint
 Open Vision for .NET


 Vision for .NET