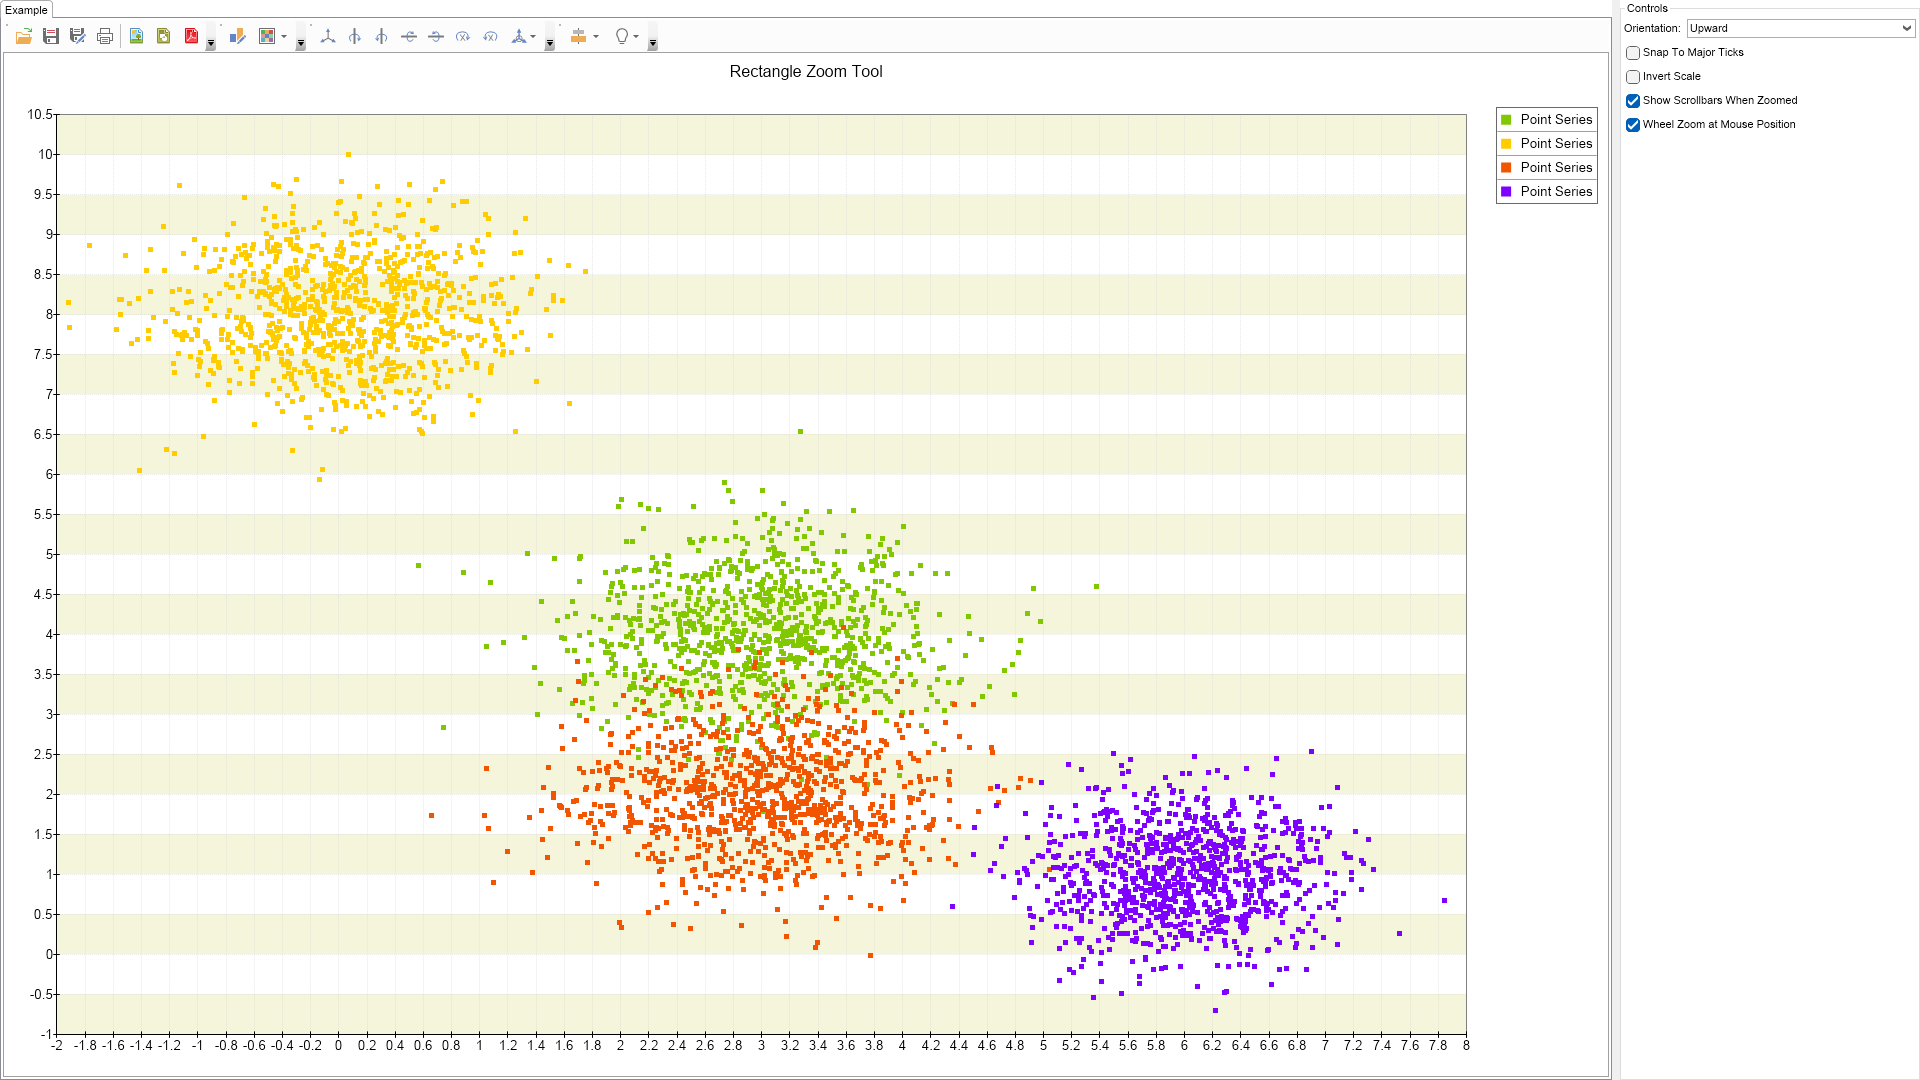
This example demonstrates how to implement zooming and scrolling. Press the left mouse button over the chart and select an area.
You can also use the mouse wheel to zoom in and out. When "Wheel Zoom at Mouse" is checked the control will zoom in out relative to the current mouse position in the chart plot.

| Language: C# |
using Nevron.Nov;
using Nevron.Nov.Chart;
using Nevron.Nov.Chart.Tools;
using Nevron.Nov.Dom;
using Nevron.Nov.Graphics;
using Nevron.Nov.Layout;
using Nevron.Nov.UI;
using Nevron.Nov.Windows.Forms;
using System;
using System.Net.Http.Headers;
using System.Windows.Forms;
namespace NovWinFormsProject
{
public partial class Form1 : Form
{
#region Constructors
public Form1()
{
InitializeComponent();
// Set form title
Text = "NOV WinForms - NDataZoomAndPanToolsExample";
// Create the NOV example and its controls
NWidget exampleContent = CreateExampleContent();
NWidget exampleControls = CreateExampleControls();
if (exampleControls != null)
{
exampleControls.PreferredWidth = 300;
}
// Place the example and its controls in a pair box
NPairBox pairBox = new NPairBox(exampleContent, exampleControls);
pairBox.FillMode = ENStackFillMode.First;
pairBox.FitMode = ENStackFitMode.First;
pairBox.Margins = new NMargins(NDesign.HorizontalSpacing, NDesign.VerticalSpacing);
// Host the example in the form
NNovWidgetHost host = new NNovWidgetHost(pairBox);
host.Dock = DockStyle.Fill;
Controls.Add(host);
}
#endregion
#region Example
public NWidget CreateExampleContent()
{
NChartViewWithCommandBars chartViewWithCommandBars = new NChartViewWithCommandBars();
NChartView chartView = chartViewWithCommandBars.View;
chartView.Surface.CreatePredefinedChart(ENPredefinedChartType.Cartesian);
// configure title
chartView.Surface.Titles[0].Text = "Rectangle Zoom Tool";
// configure chart
m_Chart = (NCartesianChart)chartView.Surface.Charts[0];
m_Chart.SetPredefinedCartesianAxes(ENPredefinedCartesianAxis.XYLinear);
// setup X axis
NLinearScale scaleX = new NLinearScale();
scaleX.MajorGridLines = new NScaleGridLines();
scaleX.MajorGridLines.Stroke.DashStyle = ENDashStyle.Dot;
m_Chart.Axes[ENCartesianAxis.PrimaryX].Scale = scaleX;
// setup Y axis
NLinearScale scaleY = new NLinearScale();
scaleY.MajorGridLines = new NScaleGridLines();
scaleY.MajorGridLines.Stroke.DashStyle = ENDashStyle.Dot;
// add interlaced stripe for Y axis
NScaleStrip strip = new NScaleStrip(new NColorFill(NColor.Beige), null, true, 0, 0, 1, 1);
strip.Interlaced = true;
scaleY.Strips.Add(strip);
m_Chart.Axes[ENCartesianAxis.PrimaryY].Scale = scaleY;
// add some random data
for (int i = 0; i < 4; i++)
{
AddPointCloud();
}
m_Chart.Enabled = true;
NInteractor interactor = new NInteractor();
m_RectangleZoomTool = new NRectangleZoomTool();
interactor.Add(m_RectangleZoomTool);
NDataPanTool dataPanTool = new NDataPanTool();
dataPanTool.StartMouseButtonEvent = ENMouseButtonEvent.RightButtonDown;
dataPanTool.EndMouseButtonEvent = ENMouseButtonEvent.RightButtonUp;
interactor.Add(dataPanTool);
m_Chart.Interactor = interactor;
chartView.Document.StyleSheets.ApplyTheme(new NChartTheme(ENChartPalette.Bright, ENChartPaletteTarget.Series));
return chartViewWithCommandBars;
}
public NWidget CreateExampleControls()
{
NStackPanel stack = new NStackPanel();
NUniSizeBoxGroup group = new NUniSizeBoxGroup(stack);
NComboBox orientationComboBox = new NComboBox();
orientationComboBox.Items.FillFromEnum();
orientationComboBox.SelectedIndex = (int)m_Chart.Orientation;
orientationComboBox.SelectedIndexChanged += OnOrientationComboBoxSelectedIndexChanged;
stack.Add(NPairBox.Create("Orientation:", orientationComboBox));
NCheckBox snapToMajorTicksCheckBox = new NCheckBox("Snap To Major Ticks");
snapToMajorTicksCheckBox.CheckedChanged += OnSnapToMajorTicksCheckBoxCheckedChanged;
stack.Add(snapToMajorTicksCheckBox);
NCheckBox invertScaleCheckBox = new NCheckBox("Invert Scale");
invertScaleCheckBox.CheckedChanged += OnInvertScaleCheckBoxCheckedChanged;
stack.Add(invertScaleCheckBox);
NCheckBox showScrollbarsWhenZoomedCheckBox = new NCheckBox("Show Scrollbars When Zoomed");
showScrollbarsWhenZoomedCheckBox.Checked = true;
showScrollbarsWhenZoomedCheckBox.CheckedChanged += OnShowScrollbarsWhenZoomedCheckBoxCheckedChanged;
stack.Add(showScrollbarsWhenZoomedCheckBox);
NCheckBox wheelZoomAtMouseCheckBox = new NCheckBox("Wheel Zoom at Mouse Position");
wheelZoomAtMouseCheckBox.Checked = true;
wheelZoomAtMouseCheckBox.CheckedChanged += OnWheelZoomAtMouseCheckBoxCheckedChanged;
stack.Add(wheelZoomAtMouseCheckBox);
return group;
}
public string GetExampleDescription()
{
return @"This example demonstrates how to implement zooming and scrolling. Press the left mouse button over the chart and select an area.
You can also use the mouse wheel to zoom in and out. When ""Wheel Zoom at Mouse"" is checked the control will zoom in out relative to the current mouse position in the chart plot.
";
}
///
/// Gets the relevant documentation links for the example
///
///
public (string Name, string Url)[] GetDocumentationUrls()
{
return new[]
{
("Zooming and Scrolling", "https://www.nevron.com/docs/openvision/chart-interactivity-zooming-and-scrolling.html"),
("Common Axis Functionality", "https://www.nevron.com/docs/openvision/chart-common-axis-functionality.html"),
("Cartesian Axes", "https://www.nevron.com/docs/openvision/cartesian-chart-axes.html"),
};
}
#endregion
#region Implementation
///
/// Adds a point cloud to the chart
///
private void AddPointCloud()
{
// add a point series
NPointSeries point = new NPointSeries();
point.Name = "Point Series";
point.DataLabelStyle = new NDataLabelStyle(false);
point.Size = 5;
point.Shape = ENPointShape3D.Bar;
point.UseXValues = true;
m_Chart.Series.Add(point);
// add some sample data
NDataPointCollection dataPoints = point.DataPoints;
Random random = new Random();
double xBase = random.Next(10);
double yBase = random.Next(10);
double scale = Math.Min(2.5, Math.Max(1.5, random.NextDouble() * 2));
for (int i = 0; i < 1000; i++)
{
double u1 = random.NextDouble();
double u2 = random.NextDouble();
if (u1 == 0)
u1 += 0.0001;
if (u2 == 0)
u2 += 0.0001;
double x = Math.Sqrt(-2 * Math.Log(u1)) * Math.Cos(2 * Math.PI * u2) / scale + xBase;
double y = Math.Sqrt(-2 * Math.Log(u1)) * Math.Sin(2 * Math.PI * u2) / scale + yBase;
dataPoints.Add(new NPointDataPoint(x, y));
}
}
#endregion
#region Event Handlers
void OnSnapToMajorTicksCheckBoxCheckedChanged(NValueChangeEventArgs arg)
{
if (((NCheckBox)arg.TargetNode).Checked)
{
m_RectangleZoomTool.HorizontalValueSnapper = new NAxisMajorTickSnapper();
m_RectangleZoomTool.VerticalValueSnapper = new NAxisMajorTickSnapper();
}
else
{
m_RectangleZoomTool.HorizontalValueSnapper = null;
m_RectangleZoomTool.VerticalValueSnapper = null;
}
}
void OnInvertScaleCheckBoxCheckedChanged(NValueChangeEventArgs arg)
{
for (int i = 0; i < m_Chart.Axes.Count; i++)
{
m_Chart.Axes[i].Scale.Invert = ((NCheckBox)arg.TargetNode).Checked;
}
}
void OnOrientationComboBoxSelectedIndexChanged(NValueChangeEventArgs arg)
{
m_Chart.Orientation = (ENCartesianChartOrientation)((NComboBox)arg.TargetNode).SelectedIndex;
}
void OnShowScrollbarsWhenZoomedCheckBoxCheckedChanged(NValueChangeEventArgs arg)
{
bool showScrollbars = ((NCheckBox)arg.TargetNode).Checked;
m_Chart.Axes[ENCartesianAxis.PrimaryX].ShowScrollbarWhenZoomed = showScrollbars;
m_Chart.Axes[ENCartesianAxis.PrimaryY].ShowScrollbarWhenZoomed = showScrollbars;
}
void OnWheelZoomAtMouseCheckBoxCheckedChanged(NValueChangeEventArgs arg)
{
bool wheelZoomAtMouse = ((NCheckBox)arg.TargetNode).Checked;
m_RectangleZoomTool.WheelZoomAtMouse = wheelZoomAtMouse;
}
#endregion
#region Fields
NCartesianChart m_Chart;
NRectangleZoomTool m_RectangleZoomTool;
#endregion
#region Static Methods
#endregion
#region Constants
#endregion
#region Nested Types
#endregion
}
}