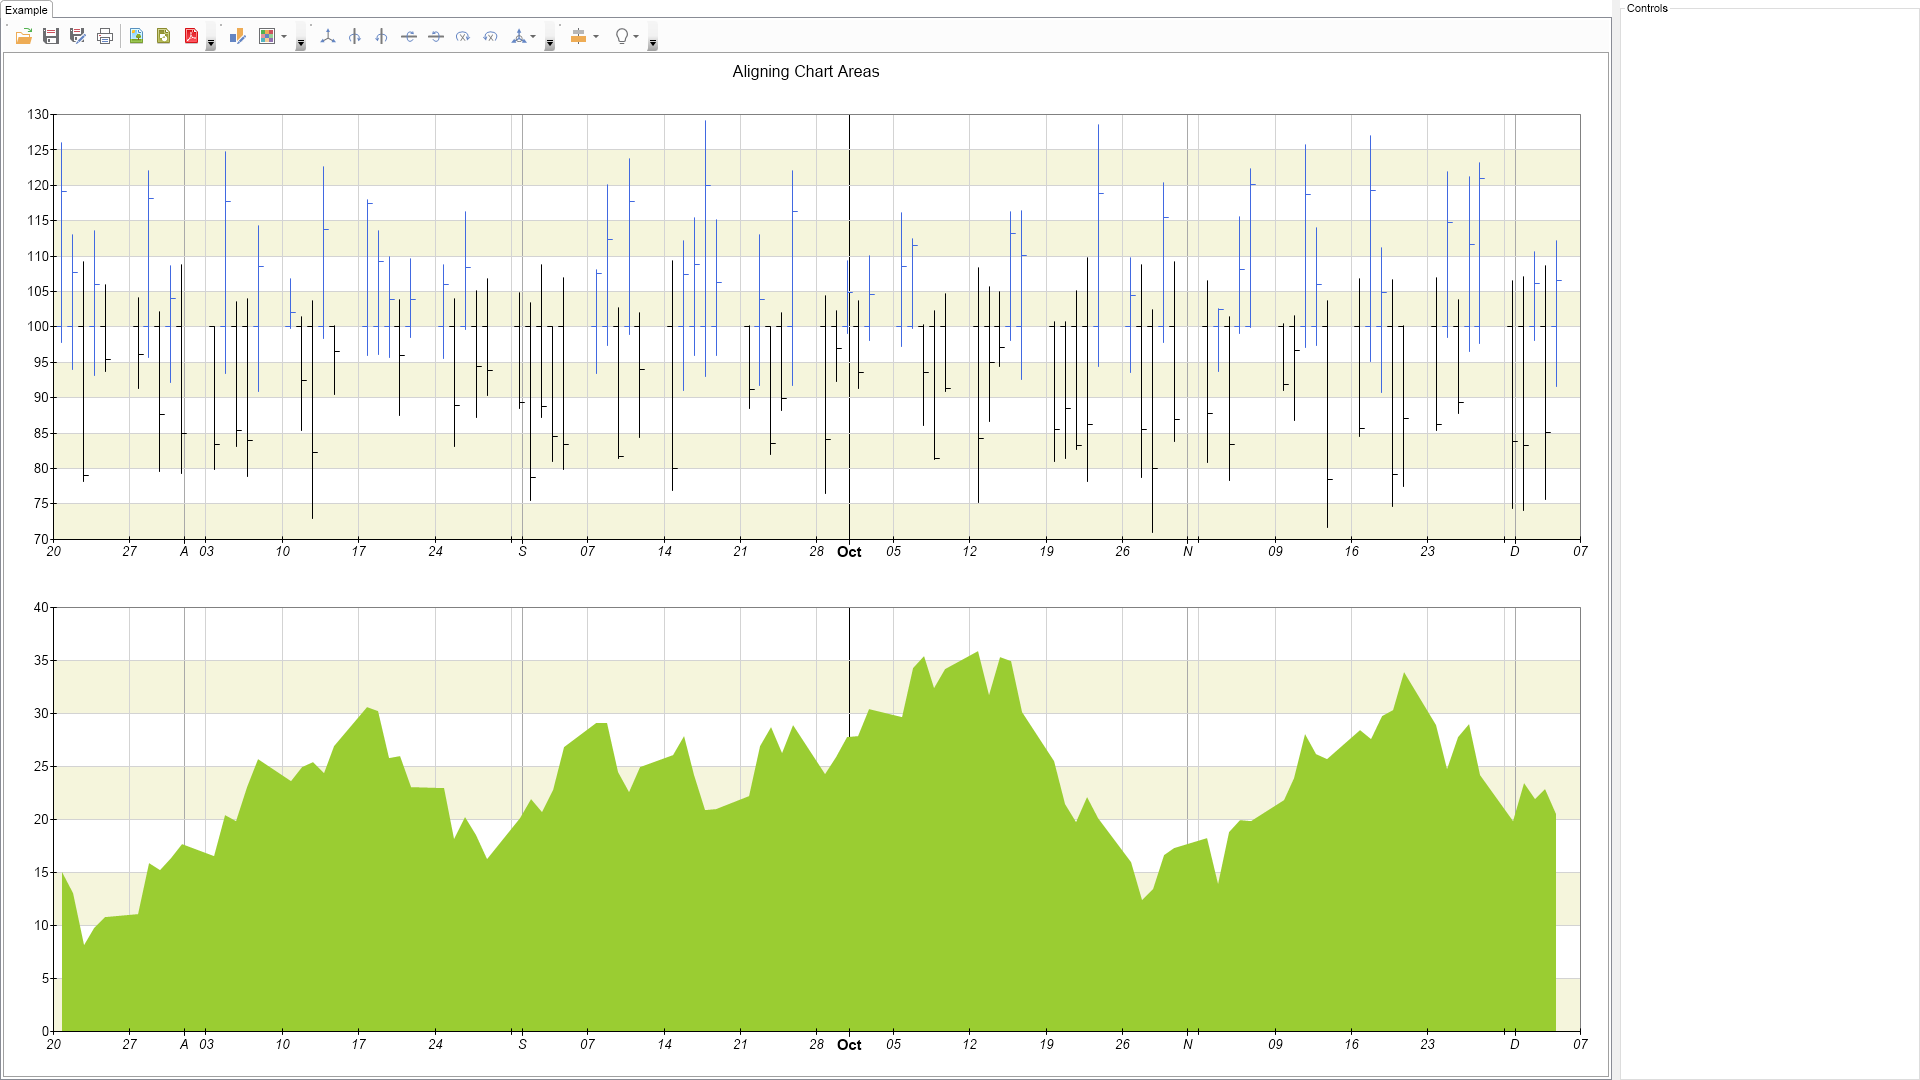
using Nevron.Nov;
using Nevron.Nov.Chart;
using Nevron.Nov.Chart.Tools;
using Nevron.Nov.Dom;
using Nevron.Nov.Graphics;
using Nevron.Nov.Layout;
using Nevron.Nov.UI;
using Nevron.Nov.Windows.Forms;
using System;
using System.Windows.Forms;
namespace NovWinFormsProject
{
public partial class Form1 : Form
{
#region Constructors
public Form1()
{
InitializeComponent();
// Set form title
Text = "NOV WinForms - NAligningChartAreasExample";
// Create the NOV example and its controls
NWidget exampleContent = CreateExampleContent();
NWidget exampleControls = CreateExampleControls();
if (exampleControls != null)
{
exampleControls.PreferredWidth = 300;
}
// Place the example and its controls in a pair box
NPairBox pairBox = new NPairBox(exampleContent, exampleControls);
pairBox.FillMode = ENStackFillMode.First;
pairBox.FitMode = ENStackFitMode.First;
pairBox.Margins = new NMargins(NDesign.HorizontalSpacing, NDesign.VerticalSpacing);
// Host the example in the form
NNovWidgetHost host = new NNovWidgetHost(pairBox);
host.Dock = DockStyle.Fill;
Controls.Add(host);
}
#endregion
#region Example
public NWidget CreateExampleContent()
{
NChartViewWithCommandBars chartViewWithCommandBars = new NChartViewWithCommandBars();
m_ChartView = chartViewWithCommandBars.View;
NDockPanel dockPanel = new NDockPanel();
m_ChartView.Surface.Content = dockPanel;
NLabel label = new NLabel();
label.Margins = new NMargins(10);
label.Font = new NFont(NFontDescriptor.DefaultSansFamilyName, 12);
label.TextFill = new NColorFill(NColor.Black);
label.TextAlignment = ENContentAlignment.MiddleCenter;
label.Text = "Aligning Chart Areas";
NDockLayout.SetDockArea(label, ENDockArea.Top);
dockPanel.AddChild(label);
// configure title
NStackPanel stackPanel = new NStackPanel();
stackPanel.UniformHeights = ENUniformSize.Max;
stackPanel.FillMode = ENStackFillMode.Equal;
stackPanel.FitMode = ENStackFitMode.Equal;
NDockLayout.SetDockArea(stackPanel, ENDockArea.Center);
dockPanel.AddChild(stackPanel);
NCartesianChart stockPriceChart = new NCartesianChart();
stockPriceChart.Tag = "Chart 1";
stockPriceChart.SetPredefinedCartesianAxes(ENPredefinedCartesianAxis.XValueTimelineYLinear);
stockPriceChart.FitMode = ENCartesianChartFitMode.Stretch;
stockPriceChart.Margins = new NMargins(10, 0, 10, 10);
ConfigureInteractivity(stockPriceChart);
stackPanel.AddChild(stockPriceChart);
// setup the stock series
m_StockPrice = new NStockSeries();
stockPriceChart.Series.Add(m_StockPrice);
m_StockPrice.Name = "Price";
m_StockPrice.LegendView.Mode = ENSeriesLegendMode.None;
m_StockPrice.DataLabelStyle = new NDataLabelStyle(false);
m_StockPrice.CandleShape = ENCandleShape.Stick;
m_StockPrice.UpStroke = new NStroke(1, NColor.RoyalBlue);
m_StockPrice.CandleWidth = 10;
m_StockPrice.UseXValues = true;
m_StockPrice.InflateMargins = false;
// setup the volume chart
NCartesianChart stockVolumeChart = new NCartesianChart();
stockVolumeChart.Tag = "Chart 2";
stockVolumeChart.SetPredefinedCartesianAxes(ENPredefinedCartesianAxis.XValueTimelineYLinear);
stockVolumeChart.FitMode = ENCartesianChartFitMode.Stretch;
stockVolumeChart.Margins = new NMargins(10, 0, 10, 10);
ConfigureInteractivity(stockVolumeChart);
stackPanel.AddChild(stockVolumeChart);
// setup the stock volume series
// setup the volume series
m_StockVolume = new NAreaSeries();
stockVolumeChart.Series.Add(m_StockVolume);
m_StockVolume.Name = "Volume";
m_StockVolume.DataLabelStyle = new NDataLabelStyle(false);
m_StockVolume.LegendView.Mode = ENSeriesLegendMode.None;
m_StockVolume.Fill = new NColorFill(NColor.YellowGreen);
m_StockVolume.UseXValues = true;
// make sure all axes are synchronized
stockPriceChart.Axes[ENCartesianAxis.PrimaryX].SynchronizedAxes = new NDomArray(new NNodeRef(stockVolumeChart.Axes[ENCartesianAxis.PrimaryX]));
stockVolumeChart.Axes[ENCartesianAxis.PrimaryX].SynchronizedAxes = new NDomArray(new NNodeRef(stockPriceChart.Axes[ENCartesianAxis.PrimaryX]));
// add interlaced stripe for Y axis
NScaleStrip stripStyle1 = new NScaleStrip(new NColorFill(NColor.Beige), null, true, 0, 0, 1, 1);
stripStyle1.Interlaced = true;
stockPriceChart.Axes[ENCartesianAxis.PrimaryY].Scale.Strips.Add(stripStyle1);
NScaleStrip stripStyle2 = new NScaleStrip(new NColorFill(NColor.Beige), null, true, 0, 0, 1, 1);
stripStyle2.Interlaced = true;
stockVolumeChart.Axes[ENCartesianAxis.PrimaryY].Scale.Strips.Add(stripStyle2);
GenerateData();
// align the left parts of those charts
NAlignmentGuidelineCollection guideLines = new NAlignmentGuidelineCollection();
NAlignmentGuideline guideLine = new NAlignmentGuideline();
guideLine.ContentSide = ENContentSide.Left;
guideLine.Targets = new NDomArray(new NNodeRef[] { new NNodeRef(stockPriceChart), new NNodeRef(stockVolumeChart) });
guideLines.Add(guideLine);
m_ChartView.Surface.AlignmentGuidelines = guideLines;
m_ChartView.Document.StyleSheets.ApplyTheme(new NChartTheme(ENChartPalette.Bright, ENChartPaletteTarget.Series));
return chartViewWithCommandBars;
}
public NWidget CreateExampleControls()
{
NStackPanel stack = new NStackPanel();
NUniSizeBoxGroup boxGroup = new NUniSizeBoxGroup(stack);
return boxGroup;
}
public string GetExampleDescription()
{
return @"This example demonstrates how to align different chart areas.
";
}
///
/// Gets the relevant documentation links for the example
///
///
public (string Name, string Url)[] GetDocumentationUrls()
{
return new[]
{
("Cartesian Chart", "https://www.nevron.com/docs/openvision/cartesian-chart.html"),
("Chart Types Overview", "https://www.nevron.com/docs/openvision/chart-types-overview.html"),
};
}
#endregion
#region Implementation
private void ConfigureInteractivity(NChart chart)
{
NInteractor interactor = new NInteractor();
NRectangleZoomTool rectangleZoomTool = new NRectangleZoomTool();
rectangleZoomTool.VerticalValueSnapper = new NAxisRulerMinMaxSnapper();
interactor.Add(rectangleZoomTool);
NDataPanTool dataPanTool = new NDataPanTool();
dataPanTool.StartMouseButtonEvent = ENMouseButtonEvent.RightButtonDown;
dataPanTool.EndMouseButtonEvent = ENMouseButtonEvent.RightButtonUp;
interactor.Add(dataPanTool);
chart.Interactor = interactor;
}
private void GenerateData()
{
double open, high, low, close;
m_StockPrice.DataPoints.Clear();
m_StockVolume.DataPoints.Clear();
DateTime dt = DateTime.Now - new TimeSpan(120, 0, 0, 0);
double dPrevClose = 100;
double dVolume = 15;
Random random = new Random();
for (int nIndex = 0; nIndex < 100; nIndex++)
{
open = dPrevClose;
if (dPrevClose < 25 || random.NextDouble() > 0.5)
{
// upward price change
close = open + (2 + (random.NextDouble() * 20));
high = close + (random.NextDouble() * 10);
low = open - (random.NextDouble() * 10);
}
else
{
// downward price change
close = open - (2 + (random.NextDouble() * 20));
high = open + (random.NextDouble() * 10);
low = close - (random.NextDouble() * 10);
}
if (low < 1)
{
low = 1;
}
while (dt.DayOfWeek == DayOfWeek.Saturday || dt.DayOfWeek == DayOfWeek.Sunday)
{
dt = dt.AddDays(1);
}
// add stock / volume data
m_StockPrice.DataPoints.Add(new NStockDataPoint(NDateTimeHelpers.ToOADate(dt), open, close, high, low));
m_StockVolume.DataPoints.Add(new NAreaDataPoint(NDateTimeHelpers.ToOADate(dt), dVolume));
// move forward
dVolume += 10 * (0.5 - random.NextDouble());
if (dVolume <= 0)
dVolume += 15;
dt = dt.AddDays(1);
}
}
#endregion
#region Event Handlers
#endregion
#region Fields
private NChartView m_ChartView;
private NStockSeries m_StockPrice;
private NAreaSeries m_StockVolume;
#endregion
#region Static Methods
#endregion
#region Constants
#endregion
#region Nested Types
#endregion
}
}

 Chart for .NET
 Diagram for .NET
 User Interface for .NET
 Vision for SSRS
 Chart for SSRS
 Gauge for SSRS
 Map for SSRS
 Barcode for SSRS
 Vision for SharePoint
 Chart for SharePoint
 Gauge for SharePoint
 Map for SharePoint
 Barcode for SharePoint
 Open Vision for .NET


 Vision for .NET