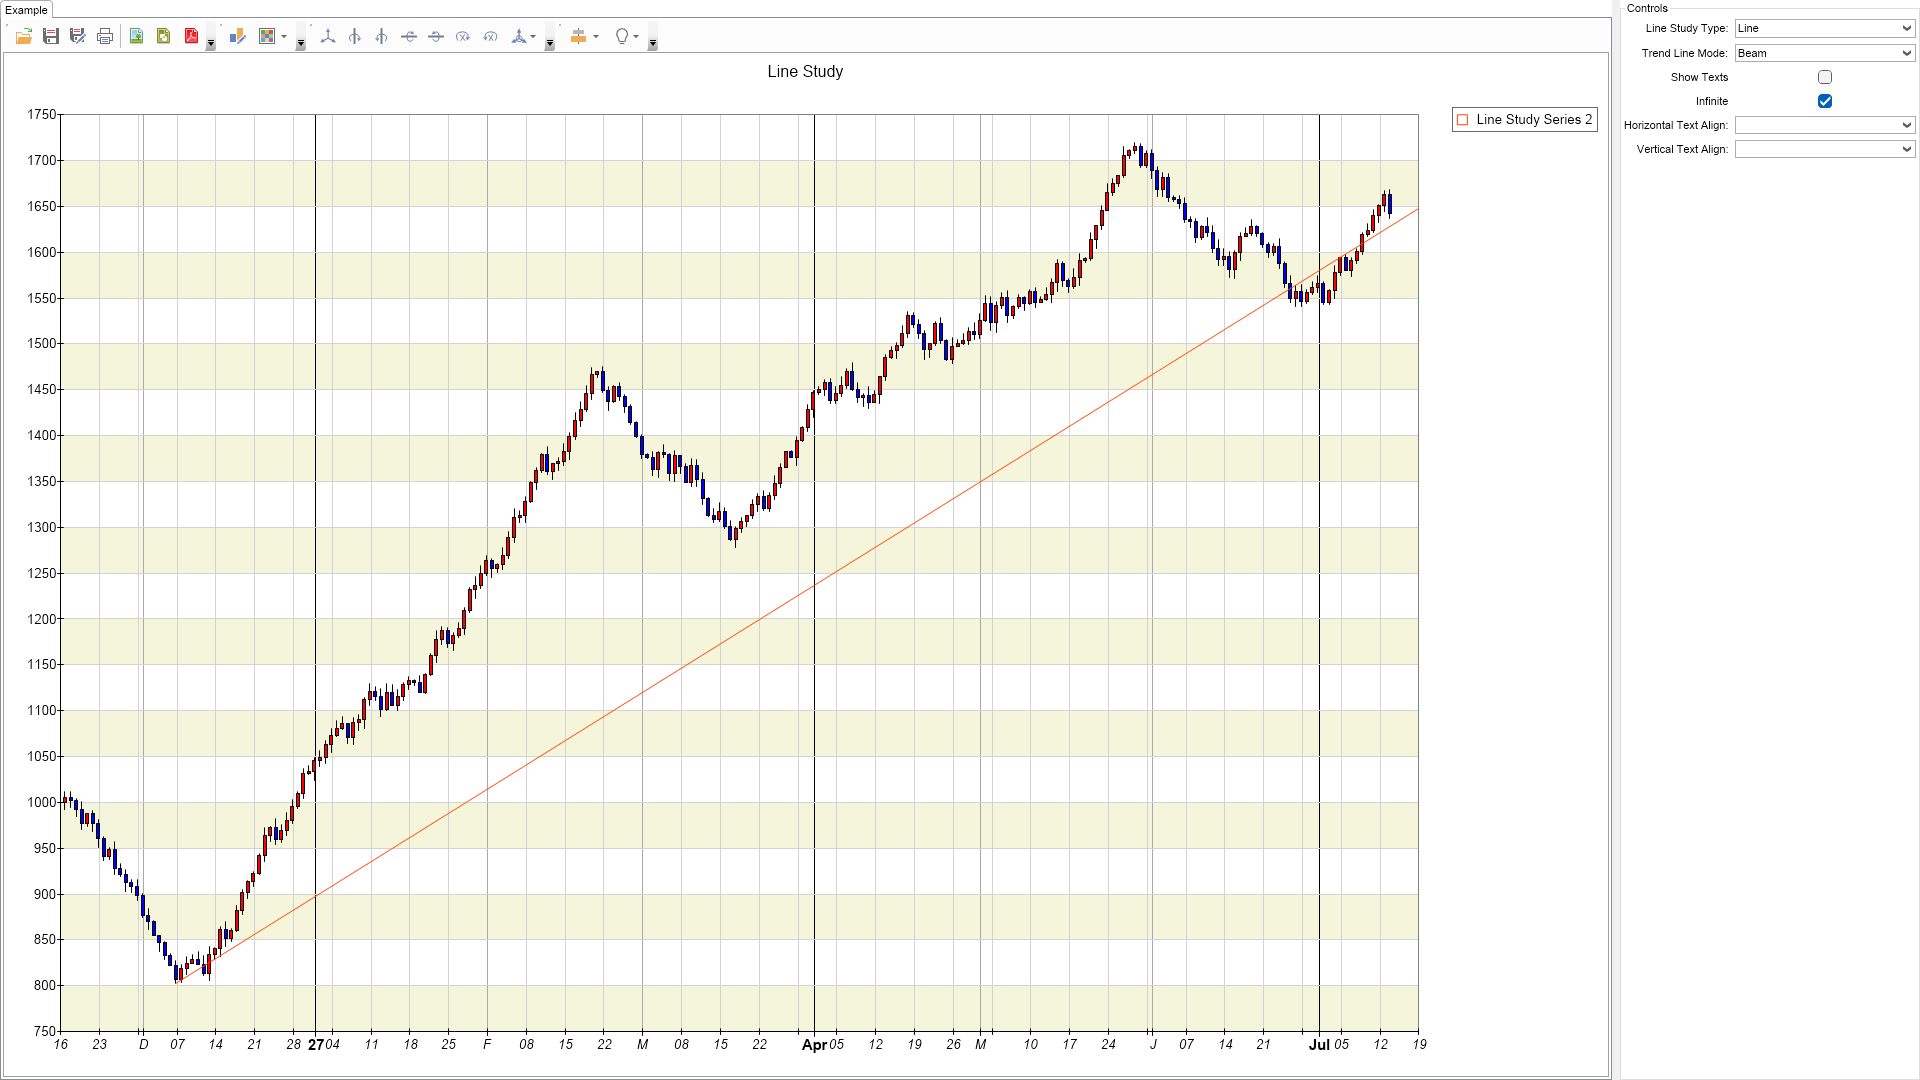
using Nevron.Nov;
using Nevron.Nov.Chart;
using Nevron.Nov.Dom;
using Nevron.Nov.Graphics;
using Nevron.Nov.Layout;
using Nevron.Nov.UI;
using Nevron.Nov.Windows.Forms;
using System;
using System.Windows.Forms;
namespace NovWinFormsProject
{
public partial class Form1 : Form
{
#region Constructors
public Form1()
{
InitializeComponent();
// Set form title
Text = "NOV WinForms - NLineStudyExample";
// Create the NOV example and its controls
NWidget exampleContent = CreateExampleContent();
NWidget exampleControls = CreateExampleControls();
if (exampleControls != null)
{
exampleControls.PreferredWidth = 300;
}
// Place the example and its controls in a pair box
NPairBox pairBox = new NPairBox(exampleContent, exampleControls);
pairBox.FillMode = ENStackFillMode.First;
pairBox.FitMode = ENStackFitMode.First;
pairBox.Margins = new NMargins(NDesign.HorizontalSpacing, NDesign.VerticalSpacing);
// Host the example in the form
NNovWidgetHost host = new NNovWidgetHost(pairBox);
host.Dock = DockStyle.Fill;
Controls.Add(host);
}
#endregion
#region Example
///
///
///
///
public NWidget CreateExampleContent()
{
NChartViewWithCommandBars chartViewWithCommandBars = new NChartViewWithCommandBars();
NChartView chartView = chartViewWithCommandBars.View;
m_View = chartView;
chartView.Surface.CreatePredefinedChart(ENPredefinedChartType.Cartesian);
// configure title
chartView.Surface.Titles[0].Text = "Line Study";
// configure chart
m_Chart = (NCartesianChart)chartView.Surface.Charts[0];
m_Chart.SetPredefinedCartesianAxes(ENPredefinedCartesianAxis.XValueTimelineYLinear);
// add interlaced stripe to the Y axis
NScaleStrip strip = new NScaleStrip(new NColorFill(ENNamedColor.Beige), null, true, 0, 0, 1, 1);
strip.Interlaced = true;
m_Chart.Axes[ENCartesianAxis.PrimaryY].Scale.Strips.Add(strip);
// setup the stock series
m_StockSeries = new NStockSeries();
m_Chart.Series.Add(m_StockSeries);
m_StockSeries.DataLabelStyle = new NDataLabelStyle(false);
m_StockSeries.CandleShape = ENCandleShape.Rectangle;
m_StockSeries.CandleWidth = 3;
m_StockSeries.LegendView.Mode = ENSeriesLegendMode.SeriesLogic;
m_StockSeries.UseXValues = true;
m_StockSeries.InflateMargins = true;
m_LineStudySeries = new NLineStudySeries();
m_LineStudySeries.DataLabelStyle = new NDataLabelStyle(true);
m_Chart.Series.Add(m_LineStudySeries);
const int dataCount = 240;
GenerateStockData(m_StockSeries, m_LineStudySeries, dataCount, 1000);
chartView.Document.StyleSheets.ApplyTheme(new NChartTheme(ENChartPalette.Bright, ENChartPaletteTarget.Series));
return chartViewWithCommandBars;
}
///
///
///
///
public NWidget CreateExampleControls()
{
NStackPanel stack = new NStackPanel();
NUniSizeBoxGroup group = new NUniSizeBoxGroup(stack);
NComboBox lineStudyTypeComboBox = new NComboBox();
lineStudyTypeComboBox.Items.FillFromEnum();
lineStudyTypeComboBox.SelectedIndexChanged += OnLineStudyTypeSelectedIndexChanged;
stack.Add(NPairBox.Create("Line Study Type:", lineStudyTypeComboBox));
NComboBox trendLineModeComboBox = new NComboBox();
trendLineModeComboBox.Items.FillFromEnum();
trendLineModeComboBox.SelectedIndexChanged += OnTrendLineModeComboBoxSelectedIndexChanged;
stack.Add(NPairBox.Create("Trend Line Mode:", trendLineModeComboBox));
NCheckBox showTextsCheckBox = new NCheckBox();
showTextsCheckBox.Checked = m_LineStudySeries.DataLabelStyle != null;
showTextsCheckBox.CheckedChanged += OnShowTextsCheckBoxCheckedChanged;
stack.Add(NPairBox.Create("Show Texts", showTextsCheckBox));
NCheckBox infiniteCheckBox = new NCheckBox();
infiniteCheckBox.CheckedChanged += OnInfiniteCheckBoxCheckedChanged;
stack.Add(NPairBox.Create("Infinite", infiniteCheckBox));
NComboBox horzTextAlign = new NComboBox();
horzTextAlign.Items.FillFromEnum();
horzTextAlign.SelectedIndexChanged += OnHorzTextAlignSelectedIndexChanged;
stack.Add(NPairBox.Create("Horizontal Text Align:", horzTextAlign));
NComboBox vertTextAlign = new NComboBox();
vertTextAlign.Items.FillFromEnum();
vertTextAlign.SelectedIndexChanged += OnVertTextAlignSelectedIndexChanged;
stack.Add(NPairBox.Create("Vertical Text Align:", vertTextAlign));
lineStudyTypeComboBox.SelectedIndex = (int)ENLineStudyType.Line;
infiniteCheckBox.Checked = true;
showTextsCheckBox.Checked = false;
trendLineModeComboBox.SelectedIndex = (int)ENTrendLineMode.Beam;
return group;
}
///
///
///
///
public string GetExampleDescription()
{
return @"This example demonstrates how to create a stock chart and overlay a line study on it.
";
}
///
/// Gets the relevant documentation links for the example
///
///
public (string Name, string Url)[] GetDocumentationUrls()
{
return new[]
{
("Line Study Series", "https://www.nevron.com/docs/openvision/linestudy-chart-series.html"),
("Common Series Functionality", "https://www.nevron.com/docs/openvision/chart-common-series-functionality.html"),
};
}
#endregion
#region Implementation
///
///
///
///
private void OnShowTextsCheckBoxCheckedChanged(NValueChangeEventArgs arg)
{
m_LineStudySeries.DataLabelStyle = new NDataLabelStyle((bool)arg.NewValue);
}
///
///
///
///
private void OnTrendLineModeComboBoxSelectedIndexChanged(NValueChangeEventArgs arg)
{
m_LineStudySeries.TrendLineMode = (ENTrendLineMode)arg.NewValue;
}
///
///
///
///
private void OnLineStudyTypeSelectedIndexChanged(NValueChangeEventArgs arg)
{
m_LineStudySeries.LineStudyType = (ENLineStudyType)arg.NewValue;
if (m_LineStudySeries.LineStudyType == ENLineStudyType.Line)
{
m_View.Surface.Titles[0].Text = "Line Study";
}
else
{
m_View.Surface.Titles[0].Text = NStringHelpers.InsertSpacesBeforeUppersAndDigits(m_LineStudySeries.LineStudyType.ToString());
}
}
///
///
///
///
///
///
///
private void GenerateStockData(NStockSeries stock, NLineStudySeries lineStudy, int count, double dPrevClose)
{
DateTime dt = DateTime.Now;
double dGrowProbability = 0.0;
double open, high, low, close;
stock.DataPoints.Clear();
Random random = new Random();
for (int nIndex = 0; nIndex < count; nIndex++)
{
open = dPrevClose;
if ((nIndex % 100) <= 20)
{
// downtrend
dGrowProbability = 0.20;
}
else
{
// uptrend
dGrowProbability = 0.75;
}
if (random.NextDouble() < dGrowProbability)
{
// upward price change
close = open + 2 + (random.NextDouble() * 20);
high = close + (random.NextDouble() * 10);
low = open - (random.NextDouble() * 10);
}
else
{
// downward price change
close = open - (2 + (random.NextDouble() * 20));
high = open + (random.NextDouble() * 10);
low = close - (random.NextDouble() * 10);
}
if (low < 1)
{
low = 1;
}
dPrevClose = close;
stock.DataPoints.Add(new NStockDataPoint(dt.ToOADate(), open, close, high, low));
dt += new TimeSpan(1, 0, 0, 0);
}
// find the points where line studies should be attached
int beginIndex = stock.FindMinValue(new NRangeI(20, stock.DataPoints.Count - 1));
int endIndex = stock.FindMinValue(new NRangeI(200, stock.DataPoints.Count - 1));
lineStudy.BeginPoint = GetLowPointFromStock(stock, beginIndex);
lineStudy.EndPoint = GetHighPointFromStock(stock, endIndex);
}
///
///
///
///
///
///
private NPoint GetLowPointFromStock(NStockSeries stock, int dataPointIndex)
{
NPoint result;
result.X = (double)stock.DataPoints[dataPointIndex].X;
result.Y = (double)stock.DataPoints[dataPointIndex].Low;
return result;
}
///
///
///
///
///
///
private NPoint GetHighPointFromStock(NStockSeries stock, int dataPointIndex)
{
NPoint result;
result.X = (double)stock.DataPoints[dataPointIndex].X;
result.Y = (double)stock.DataPoints[dataPointIndex].High;
return result;
}
#endregion
#region Event Handlers
///
///
///
///
private void OnInfiniteCheckBoxCheckedChanged(NValueChangeEventArgs arg)
{
m_LineStudySeries.Infinite = (bool)arg.NewValue;
}
///
/// Vertical text alignment
///
///
private void OnVertTextAlignSelectedIndexChanged(NValueChangeEventArgs arg)
{
m_LineStudySeries.DataLabelStyle.TextStyle.VertAlign = (ENTextVertAlign)arg.NewValue;
}
///
/// Horizontal text alignment
///
///
private void OnHorzTextAlignSelectedIndexChanged(NValueChangeEventArgs arg)
{
m_LineStudySeries.DataLabelStyle.TextStyle.HorzAlign = (ENTextHorzAlign)arg.NewValue;
}
#endregion
#region Fields
NChartView m_View;
NCartesianChart m_Chart;
NStockSeries m_StockSeries;
NLineStudySeries m_LineStudySeries;
#endregion
#region Static Methods
#endregion
#region Constants
#endregion
#region Nested Types
#endregion
}
}

 Chart for .NET
 Diagram for .NET
 User Interface for .NET
 Vision for SSRS
 Chart for SSRS
 Gauge for SSRS
 Map for SSRS
 Barcode for SSRS
 Vision for SharePoint
 Chart for SharePoint
 Gauge for SharePoint
 Map for SharePoint
 Barcode for SharePoint
 Open Vision for .NET


 Vision for .NET