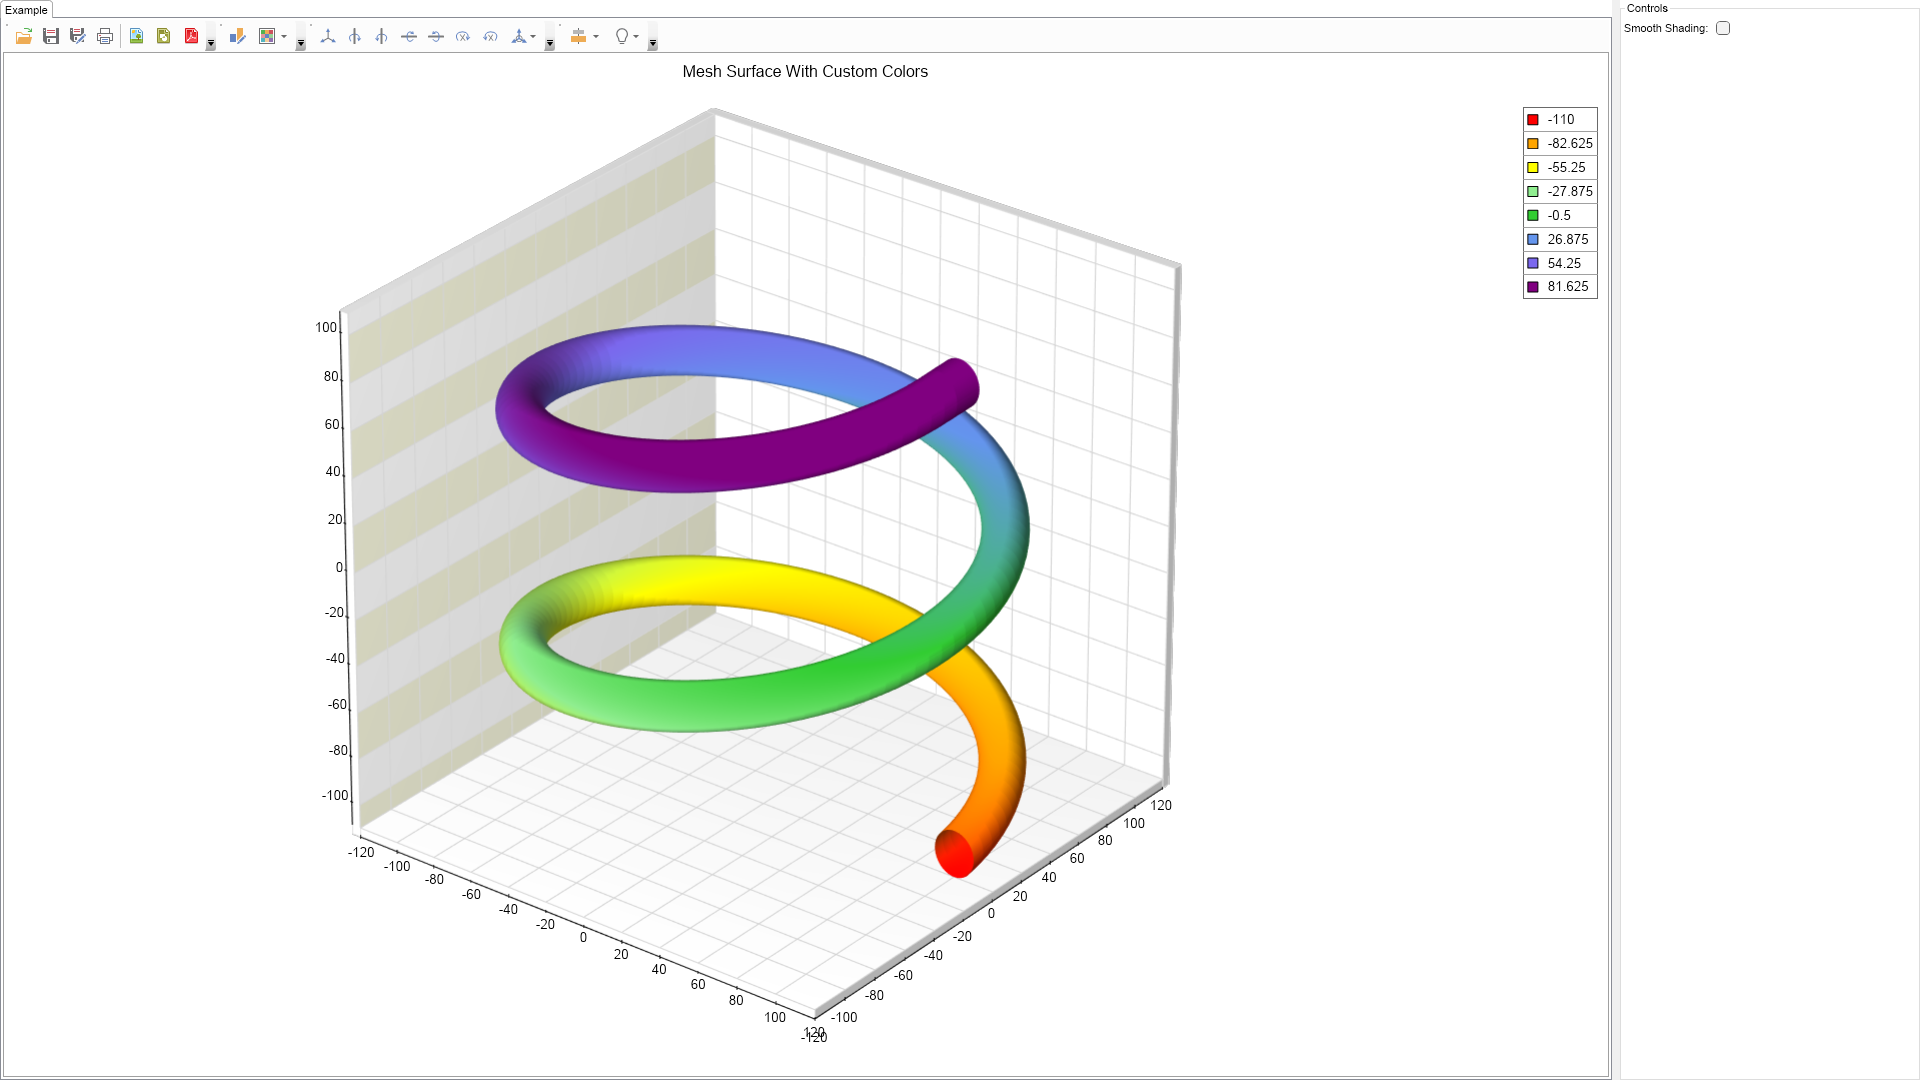
using Nevron.Nov;
using Nevron.Nov.Chart;
using Nevron.Nov.Chart.Tools;
using Nevron.Nov.Dom;
using Nevron.Nov.Graphics;
using Nevron.Nov.Layout;
using Nevron.Nov.UI;
using Nevron.Nov.Windows.Forms;
using System;
using System.Windows.Forms;
namespace NovWinFormsProject
{
public partial class Form1 : Form
{
#region Constructors
public Form1()
{
InitializeComponent();
// Set form title
Text = "NOV WinForms - NMeshSurfaceCustomColorsExample";
// Create the NOV example and its controls
NWidget exampleContent = CreateExampleContent();
NWidget exampleControls = CreateExampleControls();
if (exampleControls != null)
{
exampleControls.PreferredWidth = 300;
}
// Place the example and its controls in a pair box
NPairBox pairBox = new NPairBox(exampleContent, exampleControls);
pairBox.FillMode = ENStackFillMode.First;
pairBox.FitMode = ENStackFitMode.First;
pairBox.Margins = new NMargins(NDesign.HorizontalSpacing, NDesign.VerticalSpacing);
// Host the example in the form
NNovWidgetHost host = new NNovWidgetHost(pairBox);
host.Dock = DockStyle.Fill;
Controls.Add(host);
}
#endregion
#region Example
public NWidget CreateExampleContent()
{
NChartViewWithCommandBars chartViewWithCommandBars = new NChartViewWithCommandBars();
NChartView chartView = chartViewWithCommandBars.View;
chartView.Surface.CreatePredefinedChart(ENPredefinedChartType.Cartesian);
// configure title
chartView.Surface.Titles[0].Text = "Mesh Surface With Custom Colors";
// setup chart
NCartesianChart chart = (NCartesianChart)chartView.Surface.Charts[0];
m_Chart = chart;
chart.Enable3D = true;
chart.ModelWidth = 55.0f;
chart.ModelDepth = 55.0f;
chart.ModelHeight = 55.0f;
chart.Projection.SetPredefinedProjection(ENPredefinedProjection.PerspectiveTilted);
chart.LightModel.SetPredefinedLightModel(ENPredefinedLightModel.SoftTopLeft);
chart.Interactor = new NInteractor(new NTrackballTool());
NLinearScale scale = (NLinearScale)chart.Axes[ENCartesianAxis.PrimaryY].Scale;
scale.ViewRangeInflateMode = ENScaleViewRangeInflateMode.None;
// setup axes
NLinearScale scaleX = new NLinearScale();
chart.Axes[ENCartesianAxis.PrimaryX].Scale = scaleX;
scaleX.MajorGridLines.SetShowAtWall(ENChartWall.Bottom, true);
scaleX.MajorGridLines.SetShowAtWall(ENChartWall.Back, true);
NLinearScale scaleZ = new NLinearScale();
chart.Axes[ENCartesianAxis.Depth].Scale = scaleZ;
scaleZ.MajorGridLines.SetShowAtWall(ENChartWall.Bottom, true);
scaleZ.MajorGridLines.SetShowAtWall(ENChartWall.Left, true);
// add interlace stripe to the Y axis
NLinearScale linearScale = chart.Axes[ENCartesianAxis.PrimaryY].Scale as NLinearScale;
NScaleStrip stripStyle = new NScaleStrip(new NColorFill(NColor.Beige), null, true, 0, 0, 1, 1);
stripStyle.Interlaced = true;
stripStyle.SetShowAtWall(ENChartWall.Back, true);
stripStyle.SetShowAtWall(ENChartWall.Left, true);
linearScale.Strips.Add(stripStyle);
// add the surface series
m_Surface = new NMeshSurfaceSeries();
chart.Series.Add(m_Surface);
m_Surface.Name = "Surface";
m_Surface.LegendView.Mode = ENSeriesLegendMode.SeriesLogic;
m_Surface.FillColorMode = ENColorMode.Zone;
m_Surface.FlatPositionValue = 0.5;
m_Surface.Data.SetGridSize(20, 20);
m_Surface.Fill = new NColorFill(NColor.YellowGreen);
FillData(m_Surface);
return chartViewWithCommandBars;
}
private void FillData(NMeshSurfaceSeries surface)
{
int m = 200;
int n = 100;
int lastM = m - 1;
int lastN = n - 1;
double centerX = 0;
double centerZ = 0;
double centerY = 0;
double radius1 = 100.0;
double radius2 = 10.0;
double beginAlpha = 0;
double endAlpha = NMath.PI2;
double alphaStep = 2 * NMath.PI2 / m;
double beginBeta = 0;
double endBeta = NMath.PI2;
double betaStep = NMath.PI2 / n;
NVector2DD[] arrPrecomputedData = new NVector2DD[m];
for (int i = 0; i < m; i++)
{
// calculate the current angle, its cos and sin
double alpha = (i == lastM) ? (endAlpha) : (beginAlpha + i * alphaStep);
arrPrecomputedData[i].X = Math.Cos(alpha);
arrPrecomputedData[i].Y = Math.Sin(alpha);
}
int vertexIndex = 0;
surface.Data.HasColors = true;
surface.Data.SetGridSize(m, n);
NColor beginColor = NColor.Red;
NColor endColor = NColor.Blue;
float offset = -100;
for (int j = 0; j < n; j++)
{
// calculate the current beta angle
double beta = (j == lastN) ? (endBeta) : (beginBeta + j * betaStep);
double fCosBeta = (float)Math.Cos(beta);
double fSinBeta = (float)Math.Sin(beta);
offset = -100;
for (int i = 0; i < m; i++)
{
double fCosAlpha = arrPrecomputedData[i].X;
double fSinAlpha = arrPrecomputedData[i].Y;
double fx = fCosBeta * radius2 + radius1;
double dx = fx * fCosAlpha;
double dz = fx * fSinAlpha;
double dy = -(fSinBeta * radius2);
double x = centerX + dx;
double y = centerY + dy + offset;
double z = centerZ + dz;
offset++;
surface.Data.SetValue(i, j, y, x, z);
double length = Math.Sqrt(dx * dx + dz * dz + dy * dy);
surface.Data.SetColor(i, j, InterpolateColors(beginColor, endColor, i / 100.0f));//(length - (radius1 - radius2)) / radius2));
vertexIndex++;
}
}
}
public static NColor InterpolateColors(NColor color1, NColor color2, float factor)
{
if (factor > 1.0f)
factor = 1.0f;
else if (factor < 0.0)
factor = 0.0f;
int r1 = ((int)color1.R);
int g1 = ((int)color1.G);
int b1 = ((int)color1.B);
int r2 = ((int)color2.R);
int g2 = ((int)color2.G);
int b2 = ((int)color2.B);
byte num7 = (byte)((((float)r1) + (((float)(r2 - r1)) * factor)));
byte num8 = (byte)((((float)g1) + (((float)(g2 - g1)) * factor)));
byte num9 = (byte)((((float)b1) + (((float)(b2 - b1)) * factor)));
return NColor.FromRGB(num7, num8, num9);
}
public NWidget CreateExampleControls()
{
NStackPanel stack = new NStackPanel();
NUniSizeBoxGroup group = new NUniSizeBoxGroup(stack);
NCheckBox smoothShadingCheckBox = new NCheckBox();
smoothShadingCheckBox.CheckedChanged += OnSmoothShadingCheckBoxCheckedChanged;
smoothShadingCheckBox.Checked = false;
smoothShadingCheckBox.HorizontalPlacement = Layout.ENHorizontalPlacement.Left;
stack.Add(NPairBox.Create("Smooth Shading:", smoothShadingCheckBox));
return group;
}
private void OnSmoothShadingCheckBoxCheckedChanged(NValueChangeEventArgs arg)
{
m_Surface.ShadingMode = (bool)arg.NewValue ? ENShadingMode.Smooth : ENShadingMode.Flat;
}
public string GetExampleDescription()
{
return @"The example demonstrates the ability of the Mesh Surface Series to assign custom color per each individual surface vertex.
";
}
///
/// Gets the relevant documentation links for the example
///
///
public (string Name, string Url)[] GetDocumentationUrls()
{
return new[]
{
("Mesh Surface Series", "https://www.nevron.com/docs/openvision/mesh-surface-chart-series.html"),
("chart-palettes", "https://www.nevron.com/docs/openvision/chart-palettes.html"),
("Overview", "https://www.nevron.com/docs/openvision/chart-legeng-overview.html"),
};
}
#endregion
#region Implementation
#endregion
#region Event Handlers
#endregion
#region Fields
NChart m_Chart;
NMeshSurfaceSeries m_Surface;
#endregion
#region Static Methods
#endregion
#region Constants
#endregion
#region Nested Types
#endregion
}
}

 Chart for .NET
 Diagram for .NET
 User Interface for .NET
 Vision for SSRS
 Chart for SSRS
 Gauge for SSRS
 Map for SSRS
 Barcode for SSRS
 Vision for SharePoint
 Chart for SharePoint
 Gauge for SharePoint
 Map for SharePoint
 Barcode for SharePoint
 Open Vision for .NET


 Vision for .NET